
Glencoe Algebra 1, Student Edition, 9780079039897, 0079039898, 2018
18th Edition
ISBN: 9780079039897
Author: Carter
Publisher: McGraw Hill
expand_more
expand_more
format_list_bulleted
Related questions
Question
Need help with this question. Thank you :)
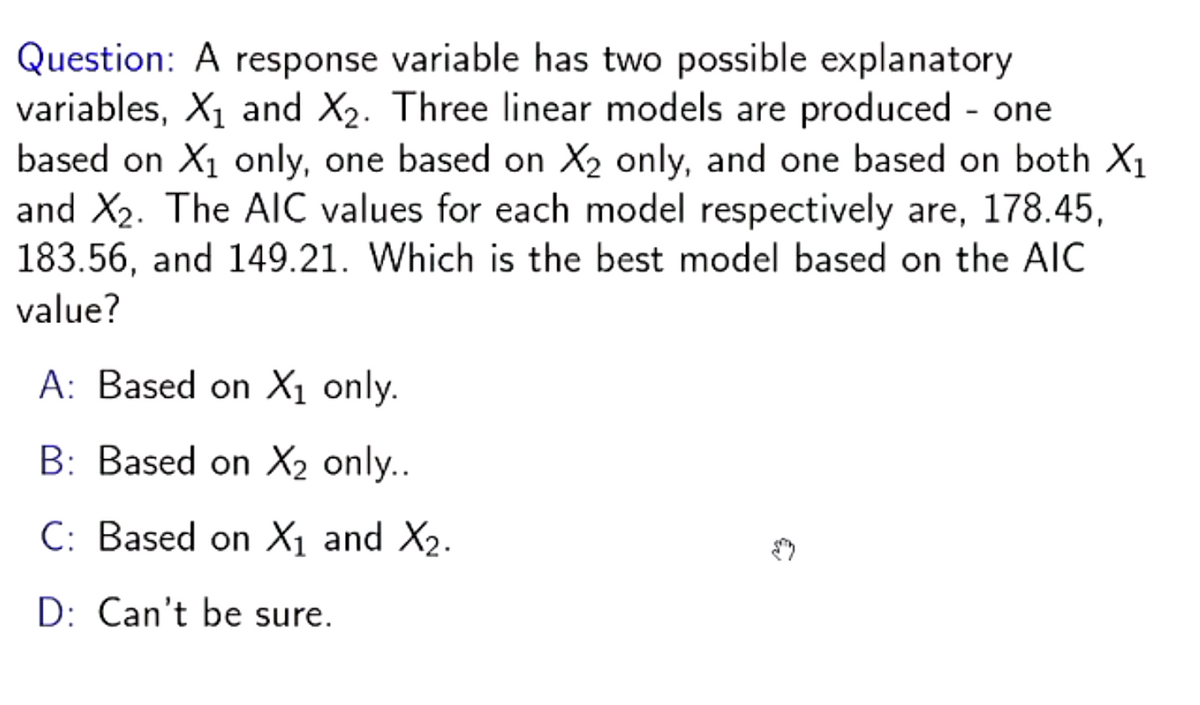

Transcribed Image Text:Question: A response variable has two possible explanatory
variables, X₁ and X₂. Three linear models are produced - one
based on X₁ only, one based on X₂ only, and one based on both X₁
and X₂. The AIC values for each model respectively are, 178.45,
183.56, and 149.21. Which is the best model based on the AIC
value?
A: Based on X₁ only.
B: Based on X₂ only..
C: Based on X₁ and X₂.
D: Can't be sure.
Expert Solution
This question has been solved!
Explore an expertly crafted, step-by-step solution for a thorough understanding of key concepts.

Step by stepSolved in 2 steps

Knowledge Booster

Similar questions
- Find the equation of the regression line for the following data set. x 1 2 3 y 0 3 4arrow_forwardSuppose a researcher wants to see if the proportion of college educated adults is higher in New York compared to Florida. The researcher randomly samples 500 adults in New York and found that 196 had a college education, while a random sample of 600 adults in Florida found that 227 had a college education.At the 0.05 level of significance, does the data provide evidence to suggest the proportion of college educated adults is higher in New York than Florida? Step 1: Define the parameter & setup the testStep 2: State the Level of SignificanceStep 3: Find the value of the Test StatisticsStep 4: Find P-Value OR Find Critical ValueStep 5: State Conclusion and whyarrow_forwardAccording to the February 2008 Federal Trade Commission report on consumer fraud and identity theft, 23% of all complaints in 2007 were for identity theft. In that year, assume some state had 544 complaints of identity theft out of 1950 consumer complaints. Do these data provide enough evidence to show that that state had a higher proportion of identity theft than 23%? Test at the 9% level.P: PARAMETER What is the correct parameter symbol for this problem? What is the wording of the parameter in the context of this problem? H: HYPOTHESES Fill in the correct null and alternative hypotheses: H0:H0: HA:HA: A: ASSUMPTIONS Since information was collected from each object, what conditions do we need to check? Check all that apply. n(1−pˆ)≥10n(1-p̂)≥10 n≥30n≥30 or normal population. σσ is unknown. σσ is known. n(1−p)≥10n(1-p)≥10 np≥10np≥10 N≥20nN≥20n n(pˆ)≥10n(p̂)≥10 Check…arrow_forward
- According to the February 2008 Federal Trade Commission report on consumer fraud and identity theft, 23% of all complaints in 2007 were for identity theft. In that year, assume some state had 534 complaints of identity theft out of 1960 consumer complaints. Do these data provide enough evidence to show that that state had a higher proportion of identity theft than 23%? Test at the 6% level.P: PARAMETER What is the correct parameter symbol for this problem? What is the wording of the parameter in the context of this problem? H: HYPOTHESES Fill in the correct null and alternative hypotheses: ASSUMPTIONS Since information was collected from each object, what conditions do we need to check? Check all that apply. np≥10np≥10 n≥30n≥30 or normal population. σσ is known. σσ is unknown. N≥20nN≥20n n(1−p)≥10arrow_forwardTo perform a test to determine whether we have a significant linear relationship using an F test, your friend tells you to compute a two-sided p-value. Is this correct and why?arrow_forwardUse Data Set 7 found on my website for this question. Consider two models: Big and Small. Both models are predicting Exam Tot. Big uses four variables (Female?, Year, Time, and H Total) to predict Exam Tot. Small uses two variables (Time and H Total) to predict Exam Tot. Run a regression for each model. Which one is a better model? Small is better, but it's arguable that Big is better Clearly Big Both are equally good / It's hard to tell. Big is better, but it's arguable that Small is better Clearly Smallarrow_forward
- A survey of high school students was done to examine whether students had ever driven a car after consuming a substantial amount of alcohol (1=yes, 0=no). Data was collected on their sex (male/female), race (White/non-White), and grade level (9,10,11,12). Researchers realized that the impact of race on consuming alcohol before driving might vary by grade level and decided to fit the following model. Variable Coding = 1 if Intercept Sex () Female Race () Black Grade level ( 9th grade 10th grade 11th grade [Reference = 12th grade] Attached is the logistic model 1. Compute the OR of drinking before driving for students who self-reported as Black versus non-Black in the 9th grade, adjusting for gender. 2. Compute the OR of drinking before driving for students who self-reported as Black versus non-Black in the 12th grade, adjusting for gender. 3. Compute the OR of drinking before driving for someone in the 9th grade versus 12th grade for a student who…arrow_forwardThe owener of a winery collects data on competing wineries every year. He would like to predict the gross sales (in number of cases) from the size of the wineries (in acres). What is the explanatory variable in this study?arrow_forwardThe relationship between IQ level and exam score was estimated as below in a linear format. (IQ level and exam scores are both measured in points) Exam score = 1.38 * IQ level - 67.43 (The p-value for the coefficient of IQ level is 0.04.) Base on the above equation, which of the following statements are true? (Select all that apply. There can be more than one answer.) The expected exam score of a person with an IQ level of 100 points is 70.57 The expected exam score of a person with an IQ level of 0 points is 1.38 points As a person’s IQ level increases by 1 point, his or her exam score is expected to increase by 1.38arrow_forward
- To monitor and improve its productivity, a company made an investigation and found out that the factor that affects the productivity the most is the absenteeism. The company data analytics department have collected data about the two variables (Productivity and Absenteeism) for the 12 past years as shown in the table below. Now the purpose of the company is to determine, through regression analysis, whether the productivity is statistically affected by the absenteeism level or not. Year Absenteeism Productivity (in number of absent worker) (in Million AED) 1 204 342 2 352 336 3 154 406 4 206 410 5 422 278 6 530 214 7 750 138 8 482 268 9 374 262 10 120 356 11 188 396 12 634 152 Questions: Construct a scatter diagram for the data about productivity and absenteeism then interpret the possible relationship that can be found. Construct a simple regression model to predict the…arrow_forwardConsider a linear regression model that relates school expenditures and family background to student performance in Massachusetts using 224 school districts. The response variable is the mean score on the MCAS (Massachusetts Comprehensive Assessment System) exam given in May 1998 to 10th-graders. Four explanatory variables are used: (1) STR is the student-to-teacher ratio, (2) TSAL is the average teacher’s salary, (3) INC is the median household income, and (4) SGL is the percentage of single family households. The Excel Regression output for the sample regression equation is given below. (a) What proportion of the variation in MCAS score is explained by the explanatory variables? (b) At the 5% level, are the explanatory variables jointly significant in explaining MCAS score? Explain briefly. (c) At the 5% level, which variables are individually significant at predicting MCAS score? Explain briefly. (d) Suppose a second regression model (Model 2) was generated using only…arrow_forwardConsider a linear regression model that relates school expenditures and family background to student performance in Massachusetts using 224 school districts. The response variable is the mean score on the MCAS (Massachusetts Comprehensive Assessment System) exam given in May 1998 to 10th-graders. Four explanatory variables are used: (1) STR is the student-to-teacher ratio, (2) TSAL is the average teacher’s salary, (3) INC is the median household income, and (4) SGL is the percentage of single family households. The Excel Regression output for the sample regression equation is given below. (a) What proportion of the variation in MCAS score is explained by the explanatory variables? (b) At the 5% level, are the explanatory variables jointly significant in explaining MCAS score? Explain briefly. (c) At the 5% level, which variables are individually significant at predicting MCAS score? Explain briefly. (d) Suppose a second regression model (Model 2) was generated using only…arrow_forward
arrow_back_ios
SEE MORE QUESTIONS
arrow_forward_ios
Recommended textbooks for you
- Glencoe Algebra 1, Student Edition, 9780079039897...AlgebraISBN:9780079039897Author:CarterPublisher:McGraw Hill
 Big Ideas Math A Bridge To Success Algebra 1: Stu...AlgebraISBN:9781680331141Author:HOUGHTON MIFFLIN HARCOURTPublisher:Houghton Mifflin Harcourt
 Functions and Change: A Modeling Approach to Coll...AlgebraISBN:9781337111348Author:Bruce Crauder, Benny Evans, Alan NoellPublisher:Cengage Learning
  Holt Mcdougal Larson Pre-algebra: Student Edition...AlgebraISBN:9780547587776Author:HOLT MCDOUGALPublisher:HOLT MCDOUGAL
 Linear Algebra: A Modern IntroductionAlgebraISBN:9781285463247Author:David PoolePublisher:Cengage Learning
Glencoe Algebra 1, Student Edition, 9780079039897...
Algebra
ISBN:9780079039897
Author:Carter
Publisher:McGraw Hill
Big Ideas Math A Bridge To Success Algebra 1: Stu...
Algebra
ISBN:9781680331141
Author:HOUGHTON MIFFLIN HARCOURT
Publisher:Houghton Mifflin Harcourt
Functions and Change: A Modeling Approach to Coll...
Algebra
ISBN:9781337111348
Author:Bruce Crauder, Benny Evans, Alan Noell
Publisher:Cengage Learning
Holt Mcdougal Larson Pre-algebra: Student Edition...
Algebra
ISBN:9780547587776
Author:HOLT MCDOUGAL
Publisher:HOLT MCDOUGAL
Linear Algebra: A Modern Introduction
Algebra
ISBN:9781285463247
Author:David Poole
Publisher:Cengage Learning