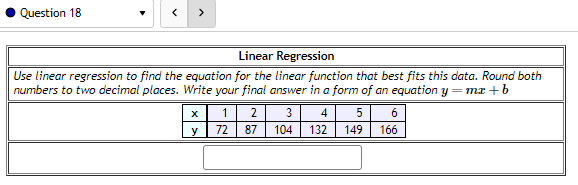
Linear Regression Use linear regression to find the equation for the linear function that best fits this data. Round both numbers to two decimal places. Write your final answer in a form of an equation y=mx+b X y 12 72 87 3 4 5 6 104 132 149 166


Q: The accompanying table shows the numbers of male and female students in a particular country who…
A: The question is about conditional probabilityGiven :To find :a ) Prob. that a rand. selected student…
Q: Please answer parts a thru d quickly and correctly On a rainy day, 30% of people carry an umbrella,…
A: Let's denote the event of carrying an umbrella as and the event of wearing a raincoat as . We are…
Q: K The English department has the faculty to offer 12 sections in any combination of the three…
A: To apportion the sections using the Hamilton method,
Q: A newspaper published an article about a study in which researchers subjected laboratory gloves to…
A: According to the given information in this questionWe need to answer all the parts
Q: Sara Fox has started her own company, Foxy Shirts, which manufactures imprinted shirts for special…
A: Cost of using equipment = $250 Material in one shirt = $10 Selling price of one shirt = $15…
Q: a) Show the this function as density possibility like proof b)find the median value
A:
Q: Q5)The graph shows the number of complaints from six different airlines to the Department of…
A: Number of complaints from six different airlines to the department of transportation in February…
Q: here are three hospitals in the Tulsa, Oklahoma, area. The following data show the number of…
A: let, Factor A = Name of different hospitals.Factor B = Different days of weekThe data is given…
Q: You are hired to study the statistical relationship between the number of trees and the number of…
A: To start with, we will define neighborhoods in a city or use pre-existing definitions (based on PIN…
Q: In a random sample of males, it was found that 27 write with their left hand and 219 do not. In a…
A: Males:Sample size 27 write with their left hand.Females:Sample size 65 write with their left…
Q: of statistics students in Oxnard College recorded the amount of rain ing the intensity by the inches…
A:
Q: Find the indicated IQ score. The graph to the right depicts IQ scores of adults, and those scores…
A: It is given thatMean, μ = 100Standard deviation, σ = 15Z-Score, Z = ( X - μ )/σwhere, Z be the…
Q: A manager is trying to educate employees on the effects of personal health and workplace…
A: Sick daysTotal hours of sleep080240160070350290435168072255
Q: Assume that we have numbers from 0 to 9 in a small box (0,1,2,3,4,5,6,7,8,9); there is only one from…
A: Solution:-To determine the number of 5-digit numbers that can be generated respecting the given…
Q: (b) The intelligent quotient of students in UTHM have a mean of 95 and a standard deviation of 10.…
A: Mean=M=95, Standard deviation=S=10
Q: today is 30%. What is the complement of the event "rain today"? What is the probability of the…
A:
Q: In a large clinical trial, 399,884 children were randomly assigned to two groups. The treatment…
A: The significance level, The number of children in the treatment group, The number of children who…
Q: You have survey data collected from a sample of students at UWL. You see from the sample that…
A: Some of the statistical tests are described as follows:One sample t test: This is used to test…
Q: Listed below are systolic blood pressure measurements (in mm Hg) obtained from the same woman. Find…
A: The data shows the systolic blood pressure for right arm and left arm.
Q: A supermarket manager finds that 20% of his customers buy Brand X cornflakes. The other 80% buy…
A: (a)The probability that at least 4 customers buy Brand X is obtained below as follows:Let the random…
Q: Please complete all work in excel. Use excel to make any necessary calculations and be sure to…
A: Given that the manager has gathered data from a group of employees to evaluate the effects of sleep…
Q: Claim: A minority of adults would erase all of their personal information online if they could. A…
A: Sample size=n=451p^=35%=0.35
Q: 3. Solve the following problem: Choose your numbers for N and x. These values for N and x must be…
A:
Q: Shown below are the scatterplots and results of three linear regression analyses done that relate…
A: Given the scatter plot of the relation between boldness and activity as
Q: HW5 1) The number of pounds of steam used per month by a chemical plant is thought to be related to…
A: The regression is the analysis used for the prediction method. It explains the relationship between…
Q: in claim? Considering only a type I error and using the same sample size, is it wise to use the same…
A: It is given that a bottle is containing a label statin that it contains pills with 500 mg of vitamin…
Q: 3. The following table shows the number of personnel, in thousands, in three brances of the U.S.…
A: Active DutyReserveNational Guard2001753560Change in 20025-152Change in 2003-125-17
Q: What is one biological interpretation of this relationship between duration and distance ? What % of…
A: What two null hypotheses are being tested with the output shown aboveH0 : b =0H1 : b ≠0What…
Q: If the level of employee satisfaction drops below 0.60 overall, then there is a belief that there…
A: The given problem involves analyzing employee satisfaction levels in the Human Resources department.…
Q: The English department has the faculty to offer 8 sections in any combination of the three courses:…
A: CoursesFictionPoetryMulticulturalEnrollment483897
Q: SOURCE:…
A: The question asks about how the results of a study were presented, specifically whether they were…
Q: Please do not give solution in image format thanku You are the operations manager for an airline…
A: are given the following information:Proportion estimate: 0.65Confidence level: c= 99%The margin of…
Q: This graph provides the lower tail probabilities for the standard normal distribution. Change the…
A: The objective is to obtain the value in the standard normal distribution, such that the area to the…
Q: With a simple random sample, the expected value for the sample percentage equals the (a) population…
A: With a simple random sample, the expected value for the sample percentage equals the(a) population…
Q: Consider the following data: 15 19 23 19 16 15 24 20 21 25 m 12-14 15-17 18-20 21-23 24-26 24 18 17…
A: Solution-:Given…
Q: Researchers conducted a study to determine whether magnets are effective in treating back pain. The…
A: Data for treatment:Sample mean, Sample standard deviation, Sample size, Data for sham:Sample mean,…
Q: Use Pitman’s formula to compute the MREE of the location parameter in the uniform family U(θ, 1 +θ)…
A: In the given problem, we are dealing with a random sample (X1, X2,..., Xn) where each Xi follows an…
Q: 2. A certain sari-sari store sells 1 "lapad" of oil at 45 pesos per lapad bottle. The lapad bottle…
A: Let the samples be taken randomlyAssume the population is normally distributedThe confidence…
Q: 4. Suppose b₁ is the least squares estimator of the slope coefficient in a regression of Y on X and…
A: The regression equation is used to predict the variables based on the independent and dependent…
Q: Let X and Y be two independent random variables. If the variance of X is 12 and the variance of Y is…
A: let x and y be two independent random variables if the variance of x is 12 and the variance of y is…
Q: Let Y: → {-1, 1} be a binary variable Y and consider its prediction from a variable X: N→ R. Prove…
A: In the given question, there are 2 variables: Y, which is a binary variable taking values {-1, 1},…
Q: K Super-Mart has stores in four locations in State A. Super-Mart plans to reapportion its 35…
A: Answer Given Seats available =35Total population =544
Q: When estimating percentages, it is the ____________ which determines accuracy, not the size…
A: When estimating percentages, it is the ____________ which determines accuracy, not the size…
Q: Number of customers arriving at a 5-star restaurant on different days of the week is given in the…
A: To determine the value of the smoothing constant alpha, we can use the exponential smoothing…
Q: Since an instant replay system for tennis was introduced at a major tournament, men challenged 1400…
A: The given claim is that men and women have equal success in challenging calls.
Q: Age limits 5.5-10.5 10.5-15.5 15.5-20.5 QUESTION ONE: The following data was obtained from a clinic…
A: The mean is calculated using all the observations. It explains the average of all the observations.…
Q: You would like to construct a 99% confidence interval to estimate the population mean score on a…
A: Confidence Interval :The confidence level represents the proportion (frequency) of acceptable…
Q: Find the mean, variance, and standard deviation of the binomial distribution with the given values…
A: Solution-:Given: n=122,p=0.52We want to find the mean, variance and standard deviation.
Q: 5. Consider the equation Y = Bo + B₁X₁ + B₂X2, where X₁ (μx₁,₁) is independent of X₂ ~ (x₂,₂). With…
A: As per the Bartleby guildlines we have to solve first three subparts and rest can be…
Q: Sketch a bell curve for the SAT critical reading data with markings on the horizontal axis for +1…
A:

Step by step
Solved in 4 steps with 2 images

- The following fictitious table shows kryptonite price, in dollar per gram, t years after 2006. t= Years since 2006 0 1 2 3 4 5 6 7 8 9 10 K= Price 56 51 50 55 58 52 45 43 44 48 51 Make a quartic model of these data. Round the regression parameters to two decimal places.Car Speed The table shows the time t (in seconds) required for a car to attain a speed of s miles per hour from a standing start. Two models for these data are given below. t1=40.757+0.556s15.817lnst2=1.2259+0.0023s2 (a) Use the regression feature of a graphing utility to find a linear model t3 and an exponential model t4 for the data. (b) Use the graphing utility to graph the data and each model in the same viewing window. (c) Create a table comparing the data with estimates obtained from each model. (d) Use the results of part (c) to find the sum of the absolute values of the differences between the data and the estimated values found using each model. Based on the four sums, which model do you think best fits the data? Explain.Olympic Pole Vault The graph in Figure 7 indicates that in recent years the winning Olympic men’s pole vault height has fallen below the value predicted by the regression line in Example 2. This might have occurred because when the pole vault was a new event there was much room for improvement in vaulters’ performances, whereas now even the best training can produce only incremental advances. Let’s see whether concentrating on more recent results gives a better predictor of future records. (a) Use the data in Table 2 (page 176) to complete the table of winning pole vault heights shown in the margin. (Note that we are using x=0 to correspond to the year 1972, where this restricted data set begins.) (b) Find the regression line for the data in part ‚(a). (c) Plot the data and the regression line on the same axes. Does the regression line seem to provide a good model for the data? (d) What does the regression line predict as the winning pole vault height for the 2012 Olympics? Compare this predicted value to the actual 2012 winning height of 5.97 m, as described on page 177. Has this new regression line provided a better prediction than the line in Example 2?
- question 22 The table below show data that has been collected from different fields from various farms in a certain valley. The table contains the grams of Raspberries tested and the amount of their Vitamin C content in mg. Find a linear model that express Vitamin C content as a function of the weight of the Raspberries. grams Vitamin Ccontent in mg 50 9.5 55 12 60 13.9 65 16.3 70 18.1 75 20.3 80 23 A) Find the regression equation: y= ______x+________ Round your answers to 3 decimal places B) Answer the following questions using your un-rounded regression equation. If we test 110 grams of raspberries what is the expected Vitamin C content? __________mg (round to the nearest tenth)Question 9 Assume a regression analysis yields a regression line with the value Y=$120,000 + $0.58X, where Y equals plant labor costs and X equals dollars of production output. If the company plans to produce $2,400,000 of product during the upcoming month, it would project plant labor costs to be: a. $324,000 b. $120,000 c. $204,000 d. $2,400,000QUESTION 4 (LINEAR REGRESSION)Based on the image attached, shows the results of one data collection. A physiotherapist advises 12 of his patients, all of whom had the same knee surgery done, to regularly perform a set of exercises. He asks them to record how long they practise. He then summarizes the average time they practised (X, time in minutes) and how long it takes them to regain their full range of motion again (Y, time in minutes).a) Construct the linear regression equation using the least square method.b) Based on the obtained linear regression line, explain the relationship between the variables X and Y.c) Sketch the scatter plot graph and the linear regression line of the recorded results.
- QUESTION 4 (LINEAR REGRESSION)Based on the image attached, shows the results of one data collection. A physiotherapist advises 12 of his patients, all of whom had the same knee surgery done, to regularly perform a set of exercises. He asks them to record how long they practise. He then summarizes the average time they practised (X, time in minutes) and how long it takes them to regain their full range of motion again (Y, time in minutes).a) Construct the linear regression equation using the least square method.b) Based on the obtained linear regression line, explain the relationship between the variables X and Y.c) Sketch the scatter plot graph and the linear regression line of the recorded results.*Help me solve these questions. Thank you.Question #9 Find the regression equation, letting the first variable be the predictor (x) variable. Using the listed lemon/crash data, where lemon imports are in metric tons and the fatality rates are per 100,000 people, find the best predicted crash fatality rate for a year in which there are 400metric tons of lemon imports. Is the prediction worthwhile? Lemon Imports 233 269 364 492 548 Crash Fatality Rate 15.9 15.7 15.4 15.4 15 Find the equation of the regression line. y= ___________+( __________ ) x (Round the y-intercept to three decimal places as needed. Round the slope to four decimal places as needed.) The best predicted crash fatality rate for a year in which there are 400 metric tons of lemon imports is _________fatalities per 100,000 population. (Round to one decimal place as needed.) Is the prediction worthwhile? A. Since all of the requirements for finding the equation of the regression line are…QUESTION 5 A student (just like you) is researching car loans issued at a local bank. She gathered a sample of 200 to determine if there is a relationship between the loan amount, length of the loan, and interest rate. The regression results are in the table below. Which model is more suitable for prediction and what is the best fit reason? Variable Model 1 Model 2 Constant 114.325 110.54 0.000 0.000 Interest Rate 106.505 108.650 (0.000) (0.000) Loan Length 0.2074 0.3290 (0.000) (0.006) Interest × Loan NA −0.1430 (0.0005) Adjusted R2 0.2178 0.2089 Model 1 is the most suitable because of the higher adjusted R2 value. Model 2 is the most suitable because of the lower adjusted R2 value. Neither provide enough results data to predict the model or reasoning. Model 2 is the most suitable because of the p-value variance.
- question 22 A researcher wishes to examine the relationship between years of schooling completed and the number of pregnancies in young women. Her research discovers a linear relationship, and the least squares line is: ˆy=4−5xy^=4-5x where x is the number of years of schooling completed and y is the number of pregnancies. The slope of the regression line can be interpreted in the following way: When amount of schooling increases by one year, the number of pregnancies tends to increase by 4. When amount of schooling increases by one year, the number of pregnancies tends to increase by 5. When amount of schooling increases by one year, the number of pregnancies tends to decrease by 4. When amount of schooling increases by one year, the number of pregnancies tends to decrease by 5.Question 16 Regression analysis was applied between sales (in $1000s) and advertising (in $100s), and the following regression function was obtained. = 500 + 4x Based on the above estimated regression line, if advertising is $10,000, then the point estimate for sales (in dollars) is _____. $505,000 $900 $40,500 $900,000Question 5 Yummy Lunch Restaurant needs to decide the most profitable location for their business expansion. Marketing manager plans to use a multiple regression model to achieve their target. His model considers yearly revenue as the dependent variable. He found that number of people within 2KM (People), Mean household income(income), no of competitors and price as explanatory variables of company yearly revenue. The following is the descriptive statistics and regression output from Excel. Revenue People Income Competitors Price Mean 343965.68 5970.26 41522.96 2.8 5.68 Standard Error 5307.89863 139.0845281 582.1376385 0.142857 0.051030203 Median 345166.5 6032 41339.5 3 5.75 Mode #N/A 5917 #N/A 3 6 Standard Deviation 37532.51115 983.47613 4116.334718 1.010153 0.360838027 Sample…


