LIRIMA t.cesmas comctrtyaleeadeocoeoctrlseie- Oc t Co lag Ye ea on 10. Estimating Proportions from Samplea Pass or Fal The othor group ecrimuted a proportion of arourd0.7 of te sips markod pass. Sroulo e cher group be more or luss confdent trat thor simcte is ccua te tre sctua popuation proportion trar we should be souut our estimute? Explain your reaconing." 02 06 08 proportion of slips marked Pass How would the voluo for the stanaard dovutor of tre sumple proportiors affect your contioonco in the arswer? Share with Cus
LIRIMA t.cesmas comctrtyaleeadeocoeoctrlseie- Oc t Co lag Ye ea on 10. Estimating Proportions from Samplea Pass or Fal The othor group ecrimuted a proportion of arourd0.7 of te sips markod pass. Sroulo e cher group be more or luss confdent trat thor simcte is ccua te tre sctua popuation proportion trar we should be souut our estimute? Explain your reaconing." 02 06 08 proportion of slips marked Pass How would the voluo for the stanaard dovutor of tre sumple proportiors affect your contioonco in the arswer? Share with Cus

Glencoe Algebra 1, Student Edition, 9780079039897, 0079039898, 2018
18th Edition
ISBN:9780079039897
Author:Carter
Publisher:Carter
Chapter4: Equations Of Linear Functions
Section: Chapter Questions
Problem 8SGR

Related questions
Topic Video
Question
Transcribed Image Text:obile LTE
5:33 PM
O 90%
5 of 18
dent.cesmas cemlactivityoulderstudent60ge7adfo826tcocteddocseeariex-
Linvi
rernur
El atiny slat.
6 Fmekynent Caa
A Ingin Essi Ensi at on.
b Sel-n ti-
hinig aln
sson 10: Estimating Proportions from Samples
8o 14
Next.
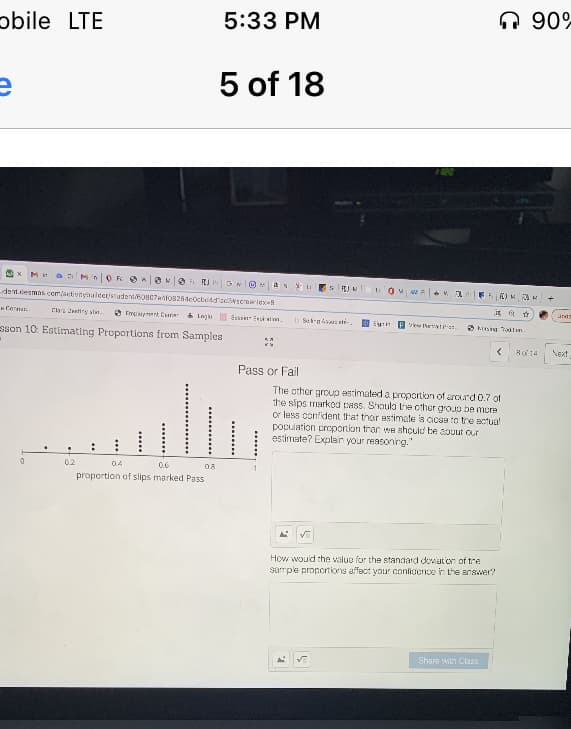
Pass or Fail
The other groug estimated a proportion of arourd 0.7 of
the sips markod pass. Shoula he other grouo be mcre
or less confident that thar astimate is cicsa to tre actua
pocuiation proportion tran we shculd be aouut our
estimate? Explan your reasonirg."
0.2
04
0.6
08
proportion of slips marked Pass
How would the value for the standard doviut oY of tre
sample proportions affect your conticence in the answer?
Share witn Class
Expert Solution
This question has been solved!
Explore an expertly crafted, step-by-step solution for a thorough understanding of key concepts.

Step by step
Solved in 3 steps

Knowledge Booster


Learn more about
Need a deep-dive on the concept behind this application? Look no further. Learn more about this topic, statistics and related others by exploring similar questions and additional content below.Recommended textbooks for you
Glencoe Algebra 1, Student Edition, 9780079039897…
Algebra
ISBN:
9780079039897
Author:
Carter
Publisher:
McGraw Hill
Glencoe Algebra 1, Student Edition, 9780079039897…
Algebra
ISBN:
9780079039897
Author:
Carter
Publisher:
McGraw Hill