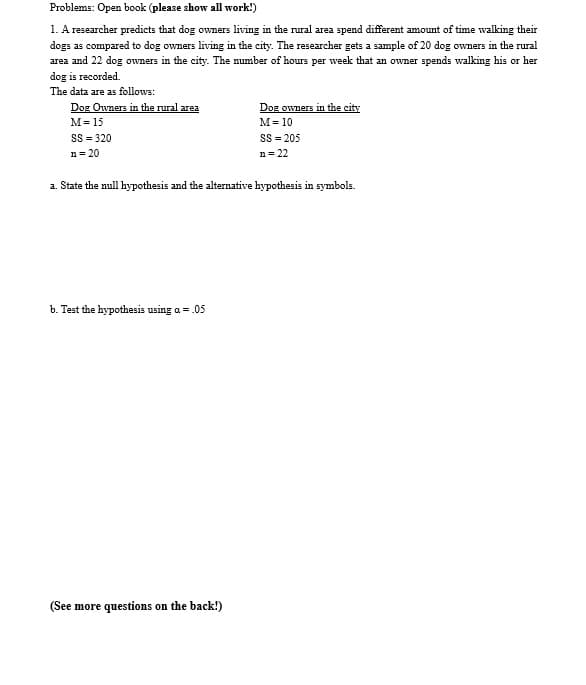
1. A researcher predicts that dog owners living in the rural area spend different amount of time walking their dogs as compared to dog owners living in the city. The researcher gets a sample of 20 dog owners in the rural area and 22 dog owners in the city. The number of hours per week that an owner spends walking his or her dog is recorded. The data are as follows: Dor Owners in the rural area M= 15 Dog owners in the citvy M= 10 SS - 320 SS - 205 n- 20 n- 22


Inverse Normal Distribution
The method used for finding the corresponding z-critical value in a normal distribution using the known probability is said to be an inverse normal distribution. The inverse normal distribution is a continuous probability distribution with a family of two parameters.
Mean, Median, Mode
It is a descriptive summary of a data set. It can be defined by using some of the measures. The central tendencies do not provide information regarding individual data from the dataset. However, they give a summary of the data set. The central tendency or measure of central tendency is a central or typical value for a probability distribution.
Z-Scores
A z-score is a unit of measurement used in statistics to describe the position of a raw score in terms of its distance from the mean, measured with reference to standard deviation from the mean. Z-scores are useful in statistics because they allow comparison between two scores that belong to different normal distributions.


Trending now
This is a popular solution!

Step by step
Solved in 2 steps


