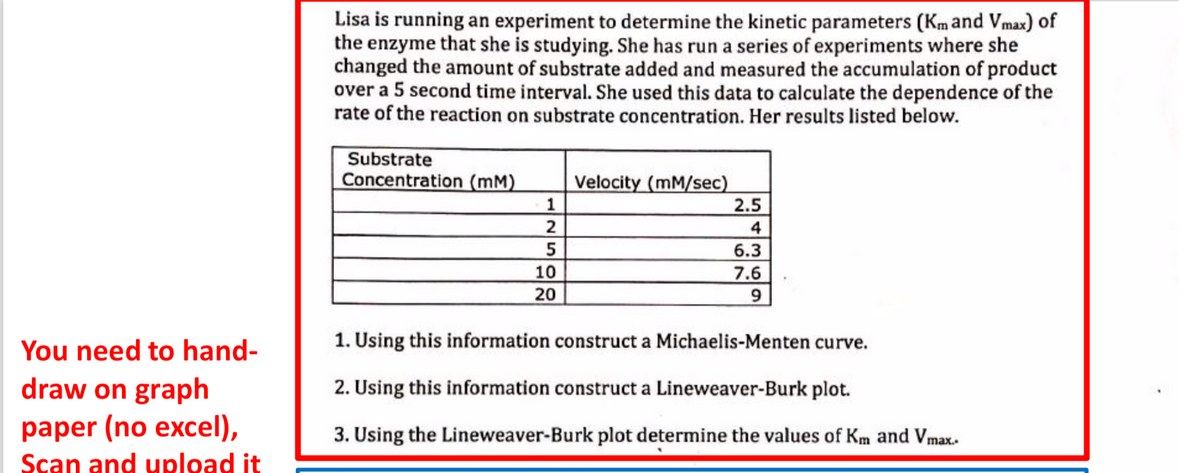
Lisa is running an experiment to determine the kinetic parameters (Kmand Vmax) of the enzyme that she is studying. She has run a series of experiments where she changed the amount of substrate added and measured the accumulation of product over a 5 second time interval. She used this data to calculate the dependence of the rate of the reaction on substrate concentration. Her results listed below. Substrate Concentration (mM) Velocity (mM/sec) 1 2 5 2.5 4 6.3 10 7.6 20 1. Using this information construct a Michaelis-Menten curve. 2. Using this information construct a Lineweaver-Burk plot. 3. Using the Lineweaver-Burk plot determine the values of Km and Vmax.
Lisa is running an experiment to determine the kinetic parameters (Kmand Vmax) of the enzyme that she is studying. She has run a series of experiments where she changed the amount of substrate added and measured the accumulation of product over a 5 second time interval. She used this data to calculate the dependence of the rate of the reaction on substrate concentration. Her results listed below. Substrate Concentration (mM) Velocity (mM/sec) 1 2 5 2.5 4 6.3 10 7.6 20 1. Using this information construct a Michaelis-Menten curve. 2. Using this information construct a Lineweaver-Burk plot. 3. Using the Lineweaver-Burk plot determine the values of Km and Vmax.

Principles of Modern Chemistry
8th Edition
ISBN:9781305079113
Author:David W. Oxtoby, H. Pat Gillis, Laurie J. Butler
Publisher:David W. Oxtoby, H. Pat Gillis, Laurie J. Butler
Chapter18: Chemical Kinetics
Section: Chapter Questions
Problem 75AP

Related questions
Question
Hello, can someone please help me? I have already hand graphed 1 and 2 and found the v max, however I cannot find the Km value. I am confused because the plots on the linear weaver burk plot do not extend past the values that make up the line. So how am I supposed to estimate the value for the y-intercept in order to find the Km value
Transcribed Image Text:Lisa is running an experiment to determine the kinetic parameters (Km and Vmax) of
the enzyme that she is studying. She has run a series of experiments where she
changed the amount of substrate added and measured the accumulation of product
over a 5 second time interval. She used this data to calculate the dependence of the
rate of the reaction on substrate concentration. Her results listed below.
Substrate
Concentration (mM)
Velocity (mM/sec)
2.5
4
6.3
7.6
1
10
20
You need to hand-
1. Using this information construct a Michaelis-Menten curve.
draw on graph
2. Using this information construct a Lineweaver-Burk plot.
paper (no excel),
3. Using the Lineweaver-Burk plot determine the values of Km and Vmax.
Scan and upload it
Expert Solution
This question has been solved!
Explore an expertly crafted, step-by-step solution for a thorough understanding of key concepts.

This is a popular solution!

Trending now
This is a popular solution!

Step by step
Solved in 3 steps with 2 images

Knowledge Booster


Learn more about
Need a deep-dive on the concept behind this application? Look no further. Learn more about this topic, chemistry and related others by exploring similar questions and additional content below.Recommended textbooks for you
Principles of Modern Chemistry
Chemistry
ISBN:
9781305079113
Author:
David W. Oxtoby, H. Pat Gillis, Laurie J. Butler
Publisher:
Cengage Learning

Chemistry: The Molecular Science
Chemistry
ISBN:
9781285199047
Author:
John W. Moore, Conrad L. Stanitski
Publisher:
Cengage Learning

Principles of Modern Chemistry
Chemistry
ISBN:
9781305079113
Author:
David W. Oxtoby, H. Pat Gillis, Laurie J. Butler
Publisher:
Cengage Learning
Chemistry: The Molecular Science
Chemistry
ISBN:
9781285199047
Author:
John W. Moore, Conrad L. Stanitski
Publisher:
Cengage Learning