Listed below are annual data for various years. The data are weights (metric tons) of imported lemons and car crash fatality rates per 100,000 population. Construct a scatterplot, find the value of the linear correlation coefficient r, and find the P-value usinga = 0.05. Is there sufficient evidence to conclude that there is a linear correlation between lemon imports and crash fatality rates? Do the results suggest that imported lemons cause car fatalities? Lemon Imports Crash Fatality Rate 232 158 357 15.4 483 153 530 14.9 264 15.7 What are the null and alternative hypotheses? OA Ho p=0 B. Ho p=0 H p#0 OD. Ho p#0 H: p=0 H, p<0 OC. Ho p=0 H p>0 Construct a scatterplot. Choose the correct graph below. OA OB. OC AY 17- 17- of
Listed below are annual data for various years. The data are weights (metric tons) of imported lemons and car crash fatality rates per 100,000 population. Construct a scatterplot, find the value of the linear correlation coefficient r, and find the P-value usinga = 0.05. Is there sufficient evidence to conclude that there is a linear correlation between lemon imports and crash fatality rates? Do the results suggest that imported lemons cause car fatalities? Lemon Imports Crash Fatality Rate 232 158 357 15.4 483 153 530 14.9 264 15.7 What are the null and alternative hypotheses? OA Ho p=0 B. Ho p=0 H p#0 OD. Ho p#0 H: p=0 H, p<0 OC. Ho p=0 H p>0 Construct a scatterplot. Choose the correct graph below. OA OB. OC AY 17- 17- of

Glencoe Algebra 1, Student Edition, 9780079039897, 0079039898, 2018
18th Edition
ISBN:9780079039897
Author:Carter
Publisher:Carter
Chapter4: Equations Of Linear Functions
Section4.5: Correlation And Causation
Problem 2AGP

Related questions
Question
6
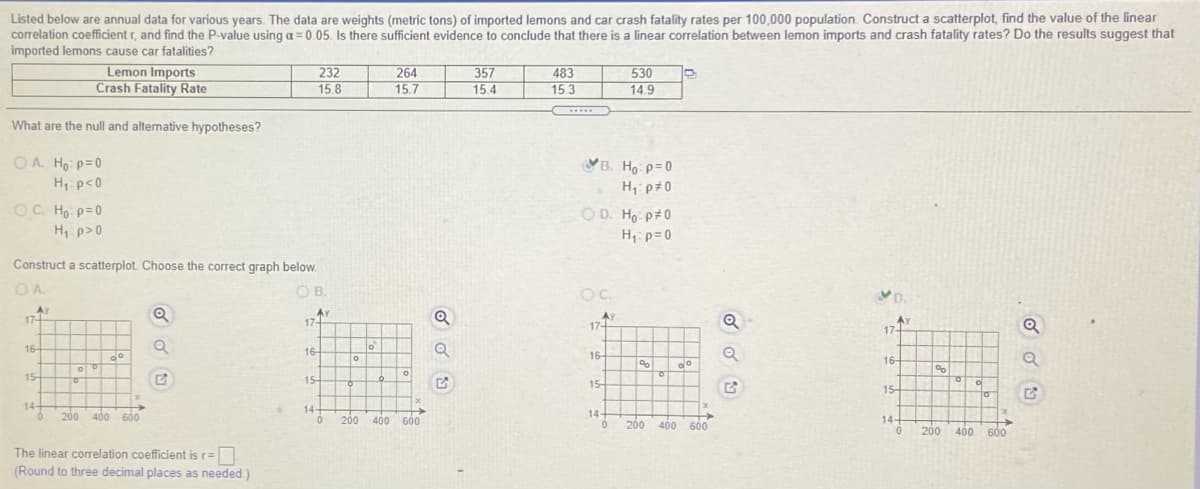
Transcribed Image Text:Listed below are annual data for various years. The data are weights (metric tons) of imported lemons and car crash fatality rates per 100,000 population. Construct a scatterplot, find the value of the linear
correlation coefficient r, and find the P-value usinga = 0.05. Is there sufficient evidence to conclude that there is a linear correlation between lemon imports and crash fatality rates? Do the results suggest that
imported lemons cause car fatalities?
Lemon Imports
Crash Fatality Rate
232
264
15.7
357
15.4
483
15.3
530
15.8
14.9
.....
What are the null and alternative hypotheses?
OA. Ho p=0
VB. Ho p= 0
H1:p<0
H1 p#0
OC. Ho p=0
OD. Ho p#0
H1 p>0
H, p= 0
Construct a scatterplot. Choose the correct graph below.
OA.
OB.
OC.
VD.
Ar
17+
Q
AY
17-
Ay
17-
Q
Ay
17-
16
16-
16-
16-
of
15-
15
15-
15-
14-
14-
200
400 600
400 600
14-
200
200 400 60
14-
200
400 600
The linear correlation coefficient is r=
(Round to three decimal places as needed)
Expert Solution
This question has been solved!
Explore an expertly crafted, step-by-step solution for a thorough understanding of key concepts.

Step by step
Solved in 2 steps with 2 images

Recommended textbooks for you
Glencoe Algebra 1, Student Edition, 9780079039897…
Algebra
ISBN:
9780079039897
Author:
Carter
Publisher:
McGraw Hill

Big Ideas Math A Bridge To Success Algebra 1: Stu…
Algebra
ISBN:
9781680331141
Author:
HOUGHTON MIFFLIN HARCOURT
Publisher:
Houghton Mifflin Harcourt
Glencoe Algebra 1, Student Edition, 9780079039897…
Algebra
ISBN:
9780079039897
Author:
Carter
Publisher:
McGraw Hill
Big Ideas Math A Bridge To Success Algebra 1: Stu…
Algebra
ISBN:
9781680331141
Author:
HOUGHTON MIFFLIN HARCOURT
Publisher:
Houghton Mifflin Harcourt