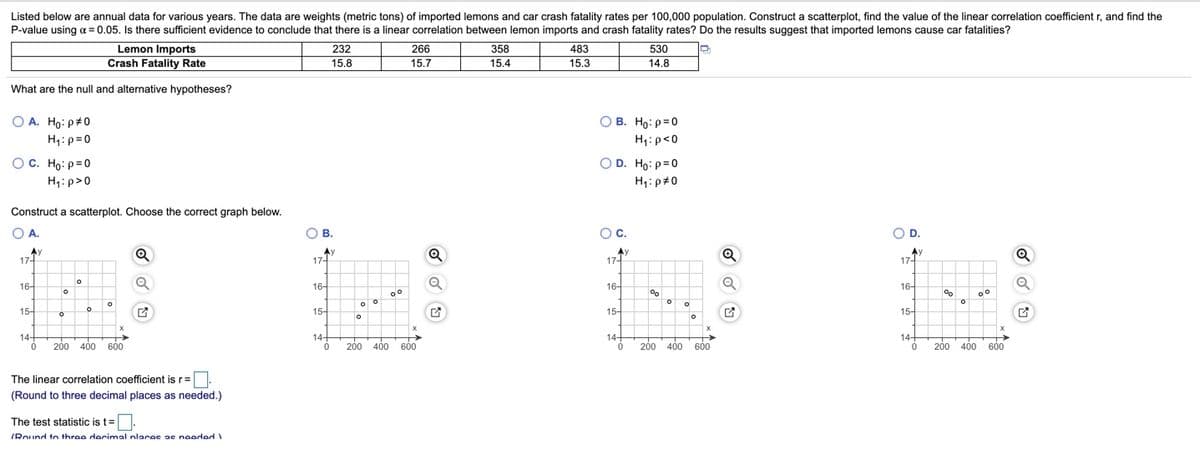
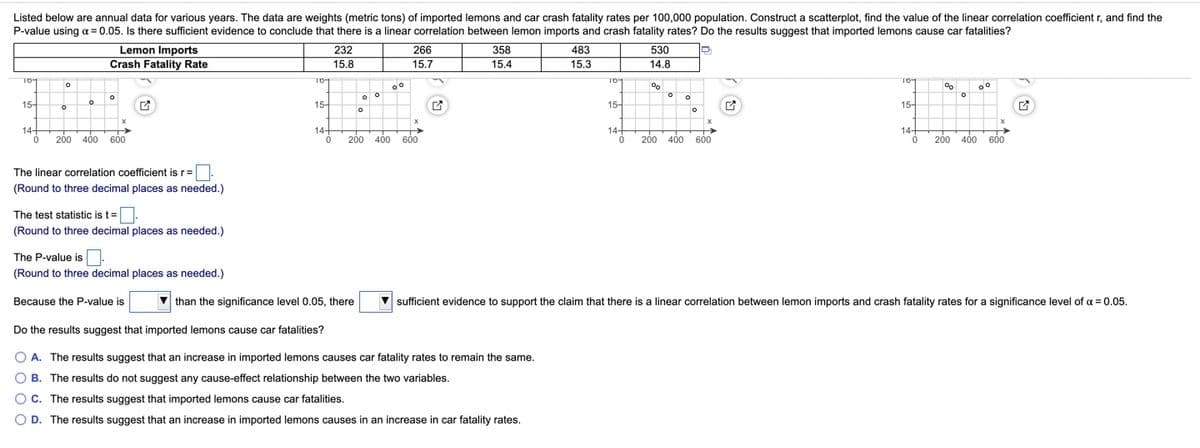
Listed below are annual data for various years. The data are weights (metric tons) of imported lemons and car crash fatality rates per 100,000 population. Construct a scatterplot, find the value of the linear correlation coefficient r, and find the P-value using a = 0.05. Is there sufficient evidence to conclude that there is a linear correlation between lemon imports and crash fatality rates? Do the results suggest that imported lemons cause car fatalities? Lemon Imports Crash Fatality Rate 232 15.8 266 15.7 483 15.3 358 530 14.8 15.4 What are the null and alternative hypotheses? O A. Ho: p#0 O B. Ho: p=0 H;:p=0 H1:p<0 OC. Ho: p=0 O D. Ho: p=0 H:p>0 H,: p40 Construct a scatterplot. Choose the correct graph below. OA. O B. Oc. OD. AY 17- Q Ay 17- Q 171 AY 17- 17- 16- 16 16- 16- 15- 15- 15- 15- 14+ 14+ 14+ 14+ 200 400 600 200 400 600 200 400 600 200 400 600 The linear correlation coefficient is r=. (Round to three decimal places as needed.) The test statistic is t= O IRnund in thraa darimal nlarae ae naarlar


Correlation
Correlation defines a relationship between two independent variables. It tells the degree to which variables move in relation to each other. When two sets of data are related to each other, there is a correlation between them.
Linear Correlation
A correlation is used to determine the relationships between numerical and categorical variables. In other words, it is an indicator of how things are connected to one another. The correlation analysis is the study of how variables are related.
Regression Analysis
Regression analysis is a statistical method in which it estimates the relationship between a dependent variable and one or more independent variable. In simple terms dependent variable is called as outcome variable and independent variable is called as predictors. Regression analysis is one of the methods to find the trends in data. The independent variable used in Regression analysis is named Predictor variable. It offers data of an associated dependent variable regarding a particular outcome.


Trending now
This is a popular solution!

Step by step
Solved in 3 steps with 6 images


