Listed below are numbers of Internet users per 100 people and numbers of scientific award winners per 10 million people for different countries. Construct a scatterplot, find the value of the linear correlation coefficient r, and find the P-value of r. Determine whether there is sufficient evidence support a claim of linear correlation between the two variables. Use a significance level of a = 0.01. 78.2 10.7 80.7 38.1 O 0.1 Internet Users 79.3 56.1 66.6 1.7 Award Winners 5.5 9.3 3.3 Construct a scatterplot. Choose the correct graph below. OA. O B. OD. 12- 12- 90 Internet Users 30 Intermet Users Internet Users Internet Users The linear correlation coefficient is r= 0.819 (Round to tkree decimal places as needed.) Determine the null and alternative hypotheses. Ho: P (Type integers or decimals. Do not round.)
Listed below are numbers of Internet users per 100 people and numbers of scientific award winners per 10 million people for different countries. Construct a scatterplot, find the value of the linear correlation coefficient r, and find the P-value of r. Determine whether there is sufficient evidence support a claim of linear correlation between the two variables. Use a significance level of a = 0.01. 78.2 10.7 80.7 38.1 O 0.1 Internet Users 79.3 56.1 66.6 1.7 Award Winners 5.5 9.3 3.3 Construct a scatterplot. Choose the correct graph below. OA. O B. OD. 12- 12- 90 Internet Users 30 Intermet Users Internet Users Internet Users The linear correlation coefficient is r= 0.819 (Round to tkree decimal places as needed.) Determine the null and alternative hypotheses. Ho: P (Type integers or decimals. Do not round.)

Glencoe Algebra 1, Student Edition, 9780079039897, 0079039898, 2018
18th Edition
ISBN:9780079039897
Author:Carter
Publisher:Carter
Chapter4: Equations Of Linear Functions
Section4.5: Correlation And Causation
Problem 11PPS

Related questions

Question
Calculate the test statistics
Calculate the p value
State conclusion
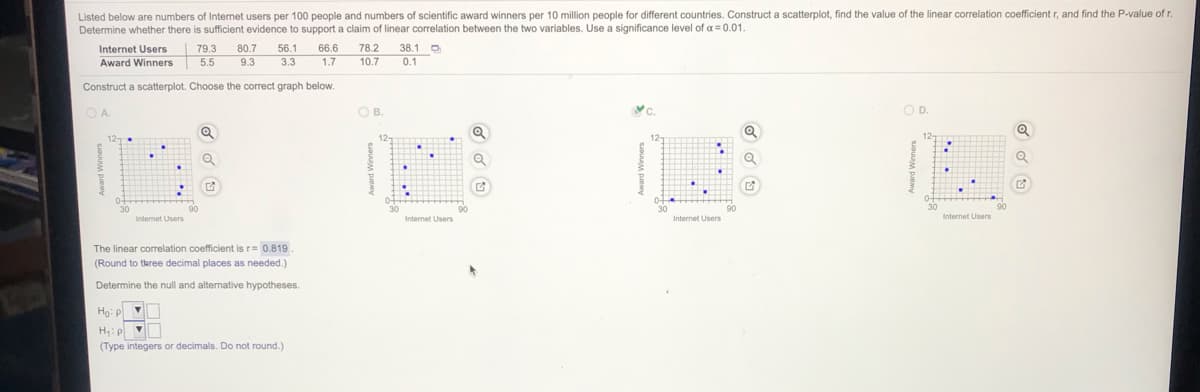
Transcribed Image Text:Listed below are numbers of Internet users per 100 people and numbers of scientific award winners per 10 million people for different countries. Construct a scatterplot, find the value of the linear correlation coefficient r, and find the P-value of r.
Determine whether there is sufficient evidence to support a claim of linear correlation between the two variables. Use a significance level of a = 0.01.
Internet Users
80.7
56.1
66.6
78.2
38.1 D
0.1
79.3
Award Winners
5.5
9.3
3.3
1.7
10.7
Construct a scatterplot. Choose the correct graph below.
OD.
Internet Users
Internet Users
Internet Users
The linear correlation coefficient is r= 0.819
(Round to tkree decimal places as needed.)
Determine the null and alternative hypotheses.
Họ:P
H: p
(Type integers or decimals. Do not round.)
Expert Solution
This question has been solved!
Explore an expertly crafted, step-by-step solution for a thorough understanding of key concepts.

Step by step
Solved in 4 steps with 1 images

Knowledge Booster


Learn more about
Need a deep-dive on the concept behind this application? Look no further. Learn more about this topic, statistics and related others by exploring similar questions and additional content below.Recommended textbooks for you
Glencoe Algebra 1, Student Edition, 9780079039897…
Algebra
ISBN:
9780079039897
Author:
Carter
Publisher:
McGraw Hill
Glencoe Algebra 1, Student Edition, 9780079039897…
Algebra
ISBN:
9780079039897
Author:
Carter
Publisher:
McGraw Hill