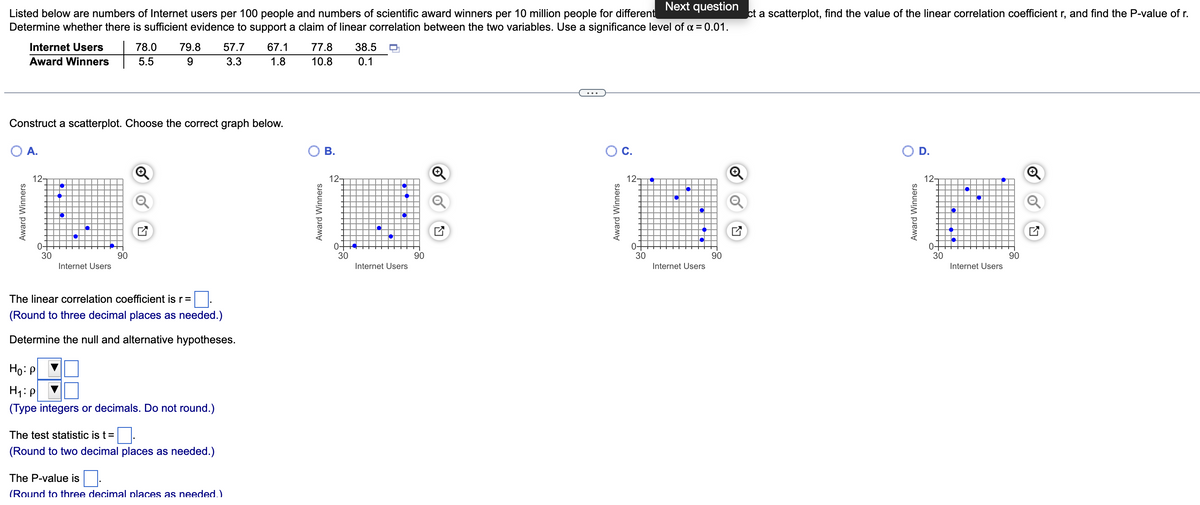
Listed below are numbers of Internet users per 100 people and numbers of scientific award winners per 10 million people for different Next question ct a scatterplot, find the value of the linear correlation coefficient r, and find the P-value of r. Determine whether there is sufficient evidence to support a claim of linear correlation between the two variables. Use a significance level of a = 0.01. Internet Users 78.0 5.5 79.8 57.7 9 3.3 67.1 77.8 1.8 10.8 38.5 0.1 Award Winners
Listed below are numbers of Internet users per 100 people and numbers of scientific award winners per 10 million people for different Next question ct a scatterplot, find the value of the linear correlation coefficient r, and find the P-value of r. Determine whether there is sufficient evidence to support a claim of linear correlation between the two variables. Use a significance level of a = 0.01. Internet Users 78.0 5.5 79.8 57.7 9 3.3 67.1 77.8 1.8 10.8 38.5 0.1 Award Winners

Glencoe Algebra 1, Student Edition, 9780079039897, 0079039898, 2018
18th Edition
ISBN:9780079039897
Author:Carter
Publisher:Carter
Chapter10: Statistics
Section10.4: Distributions Of Data
Problem 19PFA

Related questions
Question
use statcrunch to show work
Transcribed Image Text:Listed below are numbers of Internet users per 100 people and numbers of scientific award winners per 10 million people for different Next question ct a scatterplot, find the value of the linear correlation coefficient r, and find the P-value of r.
Determine whether there is sufficient evidence to support a claim of linear correlation between the two variables. Use a significance level of α = 0.01.
Internet Users
79.8 57.7 67.1
77.8
38.5
78.0
5.5
9
Award Winners
3.3
1.8
10.8
0.1
...
Construct a scatterplot. Choose the correct graph below.
D.
O A.
+
Ⓡ
30
90
Internet Users
The linear correlation coefficient is r =
(Round to three decimal places as needed.)
Determine the null and alternative hypotheses.
Ho: P
H₁: P
(Type integers or decimals. Do not round.)
The test statistic is t =
0.
(Round to two decimal places as needed.)
The P-value is
(Round to three decimal places as needed.)
Award Winners
12-
0-
Award Winners
B.
12-
+++0
30
Internet Users
90
O C.
Award Winners
12-
0+
30
O
Internet Users
90
Award Winners
12-
0-
30
·
Internet Users
90
Expert Solution
This question has been solved!
Explore an expertly crafted, step-by-step solution for a thorough understanding of key concepts.

This is a popular solution!

Trending now
This is a popular solution!

Step by step
Solved in 4 steps with 3 images

Recommended textbooks for you
Glencoe Algebra 1, Student Edition, 9780079039897…
Algebra
ISBN:
9780079039897
Author:
Carter
Publisher:
McGraw Hill
Glencoe Algebra 1, Student Edition, 9780079039897…
Algebra
ISBN:
9780079039897
Author:
Carter
Publisher:
McGraw Hill