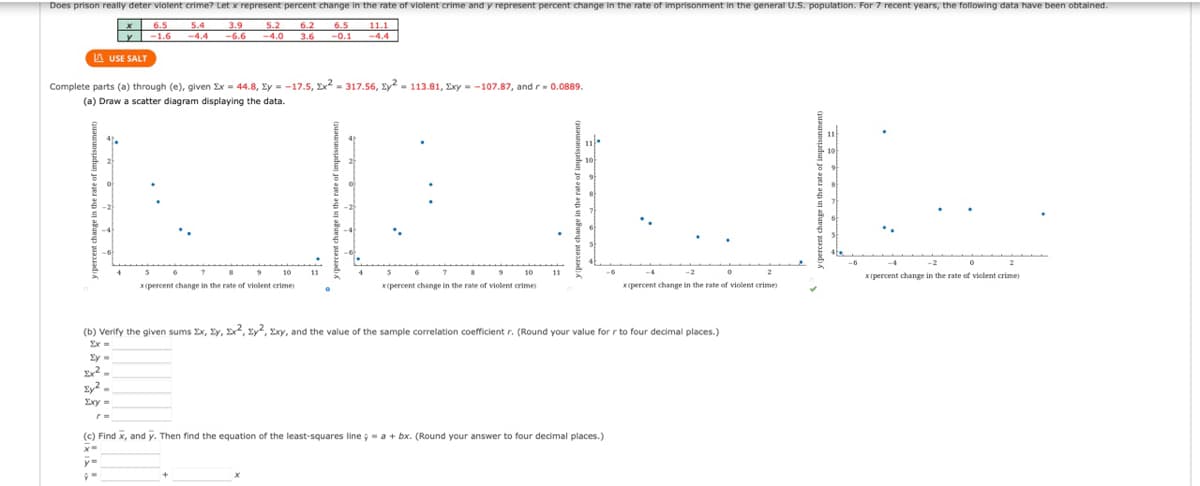
Does prison really deter violent crime? Let x represent percent change in the rate of violent crime and y represent percent change in the rate of imprisonment in the general U.S. population. For 7 recent years, the following data have been obtained. x 6.5 6.5 5.2 6.2 5.4 3.9 1.6 -4.4 -6.6 -4.0 3.6 -0.1 -4.4 y LAUSE SALT Complete parts (a) through (e), given Ex=44.8, y=-17.5, x2 = 317.56, y2 = 113.81, Exy=-107.87, and r-0.0889. (a) Draw a scatter diagram displaying the data. # x(percent change in the rate of violent crime) xpercent change in the rate of violent crime x(percent change in the rate of violent crime xpercent change in the rate of violent crime) (b) Verify the given sums x, y, x, y2, xy, and the value of the sample correlation coefficient r. (Round your value for r to four decimal places.) Ex= Ey= Sy= (c) Find x, and y. Then find the equation of the least-squares line;= a + bx. (Round your answer to four decimal places.) x= y= 9TH ܐܨܕ
Does prison really deter violent crime? Let x represent percent change in the rate of violent crime and y represent percent change in the rate of imprisonment in the general U.S. population. For 7 recent years, the following data have been obtained. x 6.5 6.5 5.2 6.2 5.4 3.9 1.6 -4.4 -6.6 -4.0 3.6 -0.1 -4.4 y LAUSE SALT Complete parts (a) through (e), given Ex=44.8, y=-17.5, x2 = 317.56, y2 = 113.81, Exy=-107.87, and r-0.0889. (a) Draw a scatter diagram displaying the data. # x(percent change in the rate of violent crime) xpercent change in the rate of violent crime x(percent change in the rate of violent crime xpercent change in the rate of violent crime) (b) Verify the given sums x, y, x, y2, xy, and the value of the sample correlation coefficient r. (Round your value for r to four decimal places.) Ex= Ey= Sy= (c) Find x, and y. Then find the equation of the least-squares line;= a + bx. (Round your answer to four decimal places.) x= y= 9TH ܐܨܕ

Functions and Change: A Modeling Approach to College Algebra (MindTap Course List)
6th Edition
ISBN:9781337111348
Author:Bruce Crauder, Benny Evans, Alan Noell
Publisher:Bruce Crauder, Benny Evans, Alan Noell
Chapter3: Straight Lines And Linear Functions
Section3.CR: Chapter Review Exercises
Problem 15CR: Life Expectancy The following table shows the average life expectancy, in years, of a child born in...

Related questions
Question
Help me answer all parts except A&D
Transcribed Image Text:Does prison really deter violent crime? Let x represent percent change in the rate of violent crime and y represent percent change in the rate of imprisonment in the general U.S. population. For 7 recent years, the following data have been obtained.
x
y
6.5 5.4
1.6 -4.4 -6.6
5.2 6.2 6.5 11.1
-4.0 3.6
-4.4
LAUSE SALT
Complete parts (a) through (e), given Ex= 44.8, Ey=-17.5, x2 = 317.56, xy2 = 113.81, Exy=-107.87, and r = 0.0889.
(a) Draw a scatter diagram displaying the data.
JE
-2
x (percent change in the rate of violent crime)
x(percent change in the rate of violent crime)
x(percent change in the rate of violent crime)
x(percent change in the rate of violent crime)
(b) Verify the given sums Ex, y, x2, xy2, xy, and the value of the sample correlation coefficient r. (Round your value for r to four decimal places.)
Ey=
Ex2-
v2.
Exy =
r=
(c) Find x, and y. Then find the equation of the least-squares line;= a + bx. (Round your answer to four decimal places.)
9-
X
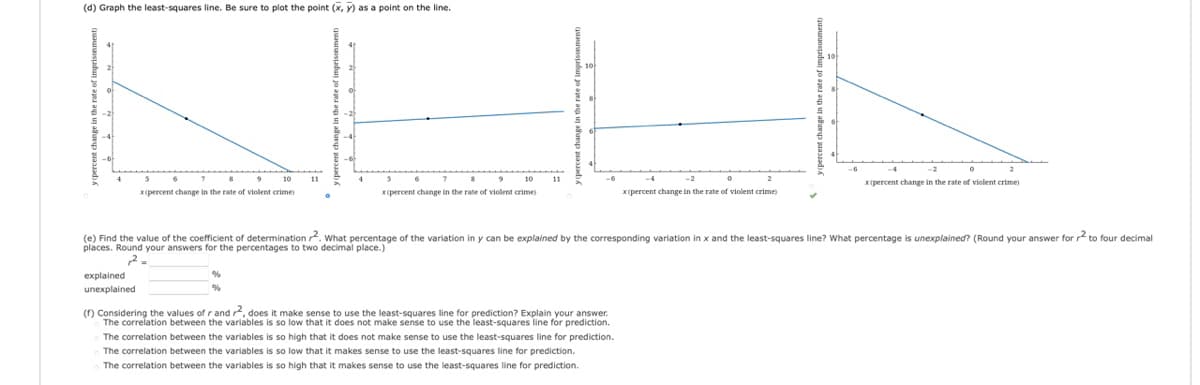
Transcribed Image Text:(d) Graph the least-squares line. Be sure to plot the point (x, y) as a point on the line.
10
x (percent change in the rate of violent crime)
x(percent change in the rate of violent crime)
x(percent change in the rate of violent crime)
x(percent change in the rate of violent crime)
(e) Find the value of the coefficient of determination 2. What percentage of the variation in y can be explained by the corresponding variation in x and the least-squares line? What percentage is unexplained? (Round your answer for 2 to four decimal
places. Round your answers for the percentages to two decimal place.)
2-
%
explained
unexplained
(f) Considering the values of r and r2, does it make sense to use the least-squares line for prediction? Explain your answer.
The correlation between the variables is so low that it does not make sense to use the least-squares line for prediction.
The correlation between the variables is so high that it does not make sense to use the least-squares line for prediction.
The correlation between the variables is so low that it makes sense to use the least-squares line for prediction.
The correlation between the variables is so high that it makes sense to use the least-squares line for prediction.
Expert Solution
This question has been solved!
Explore an expertly crafted, step-by-step solution for a thorough understanding of key concepts.

This is a popular solution!

Trending now
This is a popular solution!

Step by step
Solved in 2 steps with 1 images

Recommended textbooks for you
Functions and Change: A Modeling Approach to Coll…
Algebra
ISBN:
9781337111348
Author:
Bruce Crauder, Benny Evans, Alan Noell
Publisher:
Cengage Learning

Algebra and Trigonometry (MindTap Course List)
Algebra
ISBN:
9781305071742
Author:
James Stewart, Lothar Redlin, Saleem Watson
Publisher:
Cengage Learning

Linear Algebra: A Modern Introduction
Algebra
ISBN:
9781285463247
Author:
David Poole
Publisher:
Cengage Learning
Functions and Change: A Modeling Approach to Coll…
Algebra
ISBN:
9781337111348
Author:
Bruce Crauder, Benny Evans, Alan Noell
Publisher:
Cengage Learning
Algebra and Trigonometry (MindTap Course List)
Algebra
ISBN:
9781305071742
Author:
James Stewart, Lothar Redlin, Saleem Watson
Publisher:
Cengage Learning
Linear Algebra: A Modern Introduction
Algebra
ISBN:
9781285463247
Author:
David Poole
Publisher:
Cengage Learning

Glencoe Algebra 1, Student Edition, 9780079039897…
Algebra
ISBN:
9780079039897
Author:
Carter
Publisher:
McGraw Hill

College Algebra
Algebra
ISBN:
9781305115545
Author:
James Stewart, Lothar Redlin, Saleem Watson
Publisher:
Cengage Learning

Big Ideas Math A Bridge To Success Algebra 1: Stu…
Algebra
ISBN:
9781680331141
Author:
HOUGHTON MIFFLIN HARCOURT
Publisher:
Houghton Mifflin Harcourt