Listed below are student evaluation ratings of courses, where a rating of 5 is for "excellent." Using the bootstrap method with 200 bootstrap samples, construct a 90% confidence interval estimate of u. How does the result compare to the confidence interval 3.66
Listed below are student evaluation ratings of courses, where a rating of 5 is for "excellent." Using the bootstrap method with 200 bootstrap samples, construct a 90% confidence interval estimate of u. How does the result compare to the confidence interval 3.66

MATLAB: An Introduction with Applications
6th Edition
ISBN:9781119256830
Author:Amos Gilat
Publisher:Amos Gilat
Chapter1: Starting With Matlab
Section: Chapter Questions
Problem 1P

Related questions
Question
Please I need in 50 min Thankyou
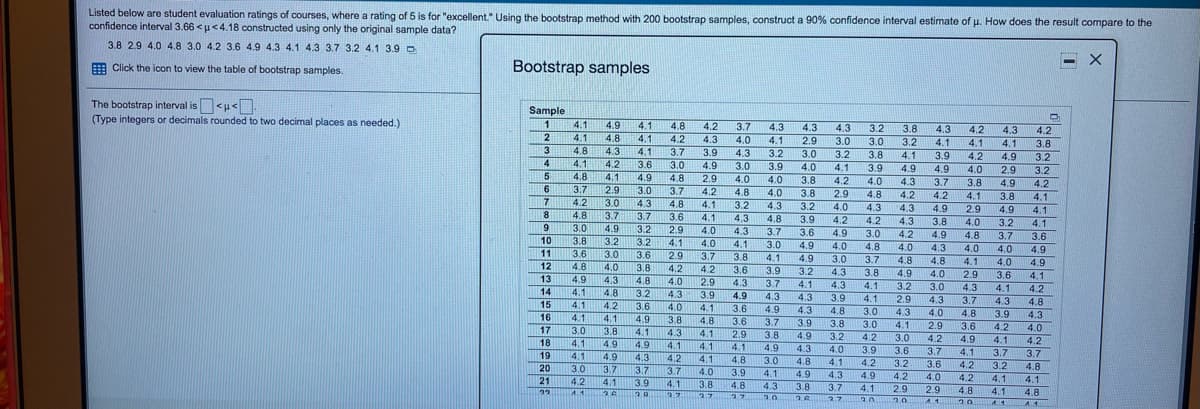
Transcribed Image Text:Listed below are student evaluation ratings of courses, where a rating of 5 is for "excellent." Using the bootstrap method with 200 bootstrap samples, construct a 90% confidence interval estimate of u. How does the result compare to the
confidence interval 3.66 <u<4.18 constructed using only the original sample data?
3.8 2.9 4.0 4.8 3.0 4.2 3.6 4.9 4.3 4.1 4.3 3.7 3.2 4.1 3.9 D
- X
E Click the icon to view the table of bootstrap samples.
Bootstrap samples
The bootstrap interval is<u<n.
(Type integers or decimals rounded to two decimal places as needed.)
Sample
1
4.1
2
4.9
4.1
4.8
4.2
3.7
4.3
4.3
4.3
3.2
3.8
4.3
4.2
4.1
4.3
4.2
4.1
4.8
4.1
4.2
4.3
4.0
4.1
2.9
3.0
3.0
3.2
4.1
4.1
3.8
3
4.3
3.9
4.8
4.1
4.8
4.1
3.7
4.3
3.2
3.0
3.2
3.8
3.9
4.0
4.8
4.1
3.9
4.2
4.9
3.2
3.2
4
4.2
3.6
3.0
4.9
3.0
3.9
4.0
4.9
4.1
4.9
4.0
2.9
4.1
2.9
3.0
3.7
4.9
4.8
2.9
4.0
4.0
4.0
3.8
4.2
4.3
3.7
3.8
4.9
3.7
4.8
4.2
4.1
6.
3.7
3.0
4.2
4.8
3.8
2.9
4.2
4.2
3.8
4.1
7
4.2
4.8
3.0
3.8
3.6
4.1
4.3
3.7
3.2
4.3
3.2
4.0
4.3
4.3
4.9
2.9
4.9
4.1
8
3.6
4.1
4.3
4.8
3.9
3.6
4.9
4.9
4.2
4.2
4.3
3.8
4.0
3.2
4.1
3.6
9
4.9
3.2
2.9
4.0
4.3
3.7
4.9
4.2
3.0
4.9
4.8
3.7
10
3.2
3.2
4.1
4.0
3.7
4.2
4.1
3.8
3.6
3.0
4.0
4.8
4.0
4.3
4.0
4.0
4.9
11
3.0
3.6
2.9
4.1
3.0
3.7
4.8
4.9
3.2
4.8
4.1
4.0
4.9
12
4.8
4.0
3.8
4.2
3.9
3.2
4.3
3.8
4.0
2.9
3.6
4.1
13
4.9
4.3
4.8
AR
4.0
4.3
2.9
4.3
3.7
4.1
4.3
4.3
4.3
4.1
3.0
4.3
4.1
4.2
14
4.1
4.8
3.2
3.9
4.1
4.9
3.6
4.3
3.9
4.1
2.9
4.3
4.0
3.7
4.3
4.8
15
4.1
4.2
4.1
3.8
3.6
14.0
4.9
4.8
3.0
4.3
4.8
3.9
16
4.1
4.9
3.8
4.8
4.3
3.6
2.9
4.1
4.8
3.7
3.8
4.9
3.0
3.9
4.9
3.8
4.1
2.9
3.6
4.2
4.0
4.2
3.7
17
3.0
4.1
4.3
4.1
4.1
3.2
4.2
3.0
4.2
18
4.9
4.9
4.1
4.9
4.1
4.1
4.3
4.0
3.9
4.1
19
4.2
3.6
3.7
3.7
4.1
4.9
4.3
4.1
3.0
4.1
4.8
4.1
4.3
3.7
37
20
4.2
3.2
3.6
4.2
3.2
4.8
3.7
3.9
3.0
3.7
3.7
4.0
3.9
4.9
3.8
4.9
4.1
4.2
4.0
2.9
21
4.2
4.1
4.2
4.1
4.1
4.1
3.8
37
4.8
37
4.3
2.9
4.8
4.1
4.8
22
126
127
2.7
2.7
2.0
12.7
20
120
A.1
Expert Solution
This question has been solved!
Explore an expertly crafted, step-by-step solution for a thorough understanding of key concepts.

This is a popular solution!

Trending now
This is a popular solution!

Step by step
Solved in 3 steps with 2 images

Recommended textbooks for you
MATLAB: An Introduction with Applications
Statistics
ISBN:
9781119256830
Author:
Amos Gilat
Publisher:
John Wiley & Sons Inc

Probability and Statistics for Engineering and th…
Statistics
ISBN:
9781305251809
Author:
Jay L. Devore
Publisher:
Cengage Learning

Statistics for The Behavioral Sciences (MindTap C…
Statistics
ISBN:
9781305504912
Author:
Frederick J Gravetter, Larry B. Wallnau
Publisher:
Cengage Learning
MATLAB: An Introduction with Applications
Statistics
ISBN:
9781119256830
Author:
Amos Gilat
Publisher:
John Wiley & Sons Inc
Probability and Statistics for Engineering and th…
Statistics
ISBN:
9781305251809
Author:
Jay L. Devore
Publisher:
Cengage Learning
Statistics for The Behavioral Sciences (MindTap C…
Statistics
ISBN:
9781305504912
Author:
Frederick J Gravetter, Larry B. Wallnau
Publisher:
Cengage Learning

Elementary Statistics: Picturing the World (7th E…
Statistics
ISBN:
9780134683416
Author:
Ron Larson, Betsy Farber
Publisher:
PEARSON

The Basic Practice of Statistics
Statistics
ISBN:
9781319042578
Author:
David S. Moore, William I. Notz, Michael A. Fligner
Publisher:
W. H. Freeman

Introduction to the Practice of Statistics
Statistics
ISBN:
9781319013387
Author:
David S. Moore, George P. McCabe, Bruce A. Craig
Publisher:
W. H. Freeman