Listed below are systolic blood pressure measurements (in mm Hg) obtained from the same woman. Find the regression equation, letting the right arm blood pressure be the predictor (x) variable. Find the be given that the systolic blood pressure in the right arm is 80 mm Hg. Use a significance level of 0.05. Right Arm 102 101 93 76 77 D Left Arm 177 172 148 147 148 Click the icon to view the critical values of the Pearson correlation coefficient r ..... The regression equation is y Ox (Round to one decimal place as needed.) Data table Given that the systolic blood pressure in the right arm is 80 mm Hg, the best predicted systolic blood pressure in the left arm is (Round to one decimal place as needed.) mm Hg
Listed below are systolic blood pressure measurements (in mm Hg) obtained from the same woman. Find the regression equation, letting the right arm blood pressure be the predictor (x) variable. Find the be given that the systolic blood pressure in the right arm is 80 mm Hg. Use a significance level of 0.05. Right Arm 102 101 93 76 77 D Left Arm 177 172 148 147 148 Click the icon to view the critical values of the Pearson correlation coefficient r ..... The regression equation is y Ox (Round to one decimal place as needed.) Data table Given that the systolic blood pressure in the right arm is 80 mm Hg, the best predicted systolic blood pressure in the left arm is (Round to one decimal place as needed.) mm Hg

Glencoe Algebra 1, Student Edition, 9780079039897, 0079039898, 2018
18th Edition
ISBN:9780079039897
Author:Carter
Publisher:Carter
Chapter4: Equations Of Linear Functions
Section4.6: Regression And Median-fit Lines
Problem 4GP

Related questions
Question
8
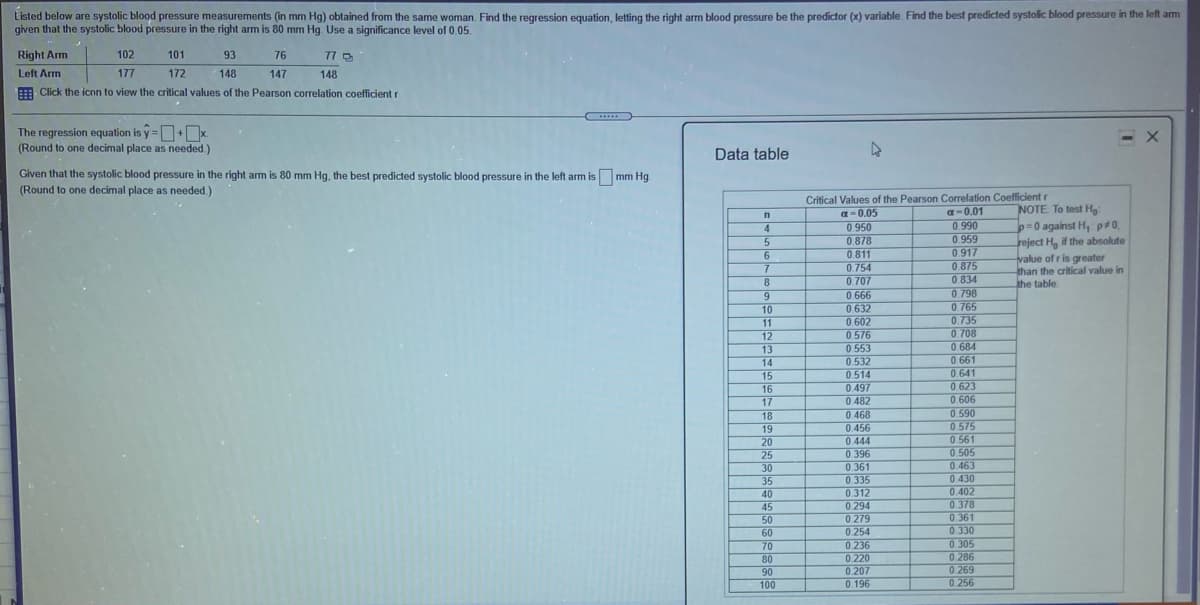
Transcribed Image Text:Listed below are systolic blood pressure measurements (in mm Hg) obtained from the same woman. Find the regression equation, letting the right arm blood pressure be the predictor (x) variable. Find the best predicted systolic blood pressure in the left am
given that the systolic blood pressure in the right arm is 80 mm Hg. Use a significance level of 0.05.
Right Arm
102
101
93
76
77 D
Left Arm
177
172
148
147
148
Click the icon to view the critical values of the Pearson correlation coefficient r
.....
The regression equation is y =D+x
(Round to one decimal place as needed.)
Data table
Given that the systolic blood pressure in the right arm is 80 mm Hg, the best predicted systolic blood pressure in the left arm is mm Hg.
(Round to one decimal place as needed.)
Critical Values of the Pearson Correlation Coefficient r
a-0.01
0.990
0.959
0.917
NOTE To test Ho
p=0 against H, p40.
a-0.05
0.950
reject H, if the absolute
value of r is greater
than the critical value in
the table.
0.878
0.811
0.754
6
0.875
0834
0.798
0.765
0.707
0.666
0.632
0.602
0576
0.553
0.532
0.514
9
10
0.735
0.708
0.684
11
12
13
14
15
0.661
0.641
0 623
0.606
0.497
16
17
18
19
0.482
0.468
0.590
0.575
0.561
0.505
0.463
0.430
0.402
0.378
0.361
0.330
0.305
0.456
0.444
0.396
0.361
0.335
0.312
0.294
20
25
30
35
40
45
50
60
0.279
0.254
70
0.236
80
0.220
0.286
90
0.207
0.269
100
0.196
0.256
Expert Solution
This question has been solved!
Explore an expertly crafted, step-by-step solution for a thorough understanding of key concepts.

Step by step
Solved in 3 steps with 2 images

Recommended textbooks for you
Glencoe Algebra 1, Student Edition, 9780079039897…
Algebra
ISBN:
9780079039897
Author:
Carter
Publisher:
McGraw Hill

Functions and Change: A Modeling Approach to Coll…
Algebra
ISBN:
9781337111348
Author:
Bruce Crauder, Benny Evans, Alan Noell
Publisher:
Cengage Learning
Glencoe Algebra 1, Student Edition, 9780079039897…
Algebra
ISBN:
9780079039897
Author:
Carter
Publisher:
McGraw Hill
Functions and Change: A Modeling Approach to Coll…
Algebra
ISBN:
9781337111348
Author:
Bruce Crauder, Benny Evans, Alan Noell
Publisher:
Cengage Learning