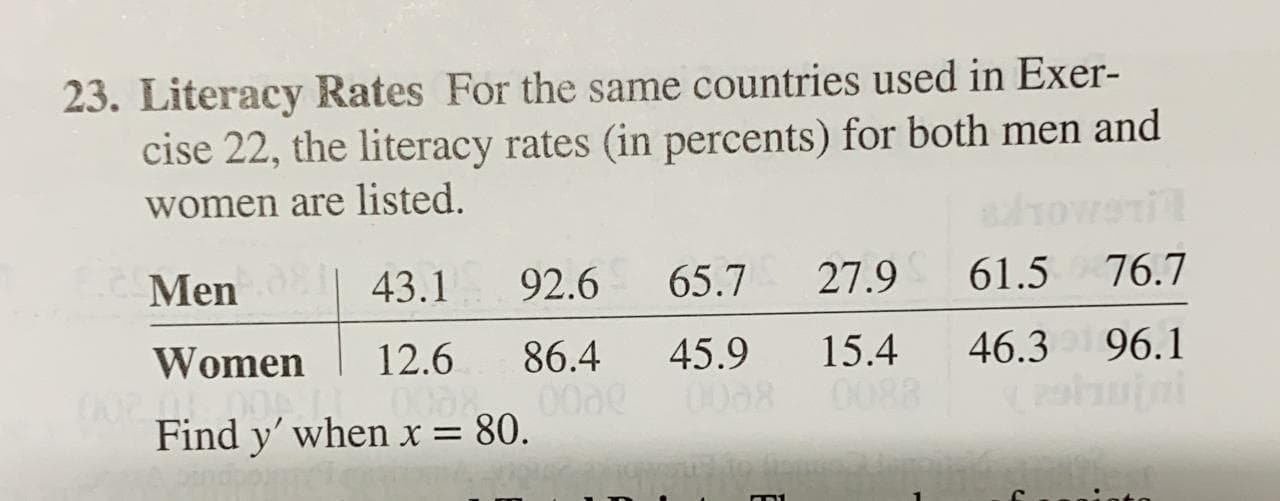
Literacy Rates For the same countries used in Exer- cise 22, the literacy rates (in percents) for both men and women are listed. Men 43.1 92.6 65.7 27.9 61.5 76.7 Women 12.6 45.9 46.3 96.1 86.4 0000 Find y' when x= 80. 15.4 0088


Q: Lecture(12.6b): Resaerchers were interested in the effects of maternal stress on infants…
A: Given that Researchers were interested in the effects of maternal stress on infants production of…
Q: Carbon dioxide is known to have a critical effect on microbiological growth. Small amounts of CO2…
A: Hello! As you have posted more than 3 sub parts, we are answering the first 3 sub-parts. In case…
Q: 25 I. conversi 20 on of taxadien 15 (mg/ml) 10 strain 17 strain 26 strain 22 Figure 2. New E. coli…
A: (a) The given graph is a bar graph with E.coil strains on the x-axis and the amount of conversion of…
Q: Decreasing the alpha level (for example from = .05 to = .01) ____. a Decreases the probability…
A: The level of significance α is the probability of type I error. So, as the alpha decreases the…
Q: 2) A large industrial explosion occurred near a densely populated region in a major city. The…
A: Given data >60: High Exposure 40-59: Medium Exposure 20-39: Low Exposure <20: No exposure…
Q: 2-Month Moving Absol Actual Sales (# of Product X) Month Average Forecast - Sales (# of Product X)…
A: Data is given for every month for actual sales. We have to fill the table by using 2 months moving…
Q: Some scientists consider a concentration of 5.0 ppm for dissolved O2 to be the lower limit of the…
A: Mu represents the average dissolved O2 concentration . By using Hypothesis testing concept, we can…
Q: A production process is currently operating at + 4.5 a level. a. Calculate the nonconforming ratio…
A: Answer: Part A: --------------------------- Here, For a ± 4.5σ level, the 'z' score is 4.5.…
Q: 35. Which statement below accurately describes the relationship between the alpha level, the size of…
A: We have given the following statement the relationship between the alpha level, the size of the…
Q: 1. Since the pandemic the price of gasoline varies constantly from the last two months.However, you…
A: Given that, From the last two months data price of a gasoline varies Due to pandemic constantly.
Q: 1. Approximating the beta of a stock. Choose e well-known compeny such es Google or Coco-Cole. Go to…
A:
Q: true or flase In an independent-samples t-test, the parameter of interest is the difference between…
A: Parameter: The statistical measure that describes the features the population is termed as…
Q: The minister of environment in a certain country decided to investigate whether expansion of a…
A: INTRODUCTION : PAIRED T TEST let the sample sizes of the two samples are equal and the sample…
Q: Dr. Ahmed wants to study the relationship between blood pressure and heartbeat irregularities in his…
A:
Q: A very tough terrain is used to test out the vehicle's features. The x-variable represents the…
A: a) Rate of change of speed in blizzard = Slope of given graph for blizzard = 90-00-12 = -9012…
Q: Estimation is a procedure by which we assign a numerical value or numerical values t O population…
A: The parameter is defined as the numerical descriptive measure of the population. The statistics…
Q: Lemons and Car Crashes Listed below are annual data for various years. The data are weights (metric…
A: Given: The annual data for various years of lemon imports and crash fatality rates. The significance…
Q: 5. Literacy Rates For the same countries used in Exer- cise 22, the literacy rates (in percents) for…
A:
Q: Create a scatter diagram of Y = ‘Annual % ROI’ against X = ‘Cost’. Include the trendline and the…
A: (1). Construct a scatterplot for the given data: The data represents the values of the variables X =…
Q: The American Mineralogist (Oct. 2009) published a study of the evolution of uranium minerals in the…
A: (b) The probability of X lies between 2 and 2.6 is, Therefore, the required probability is, 0.30
Q: ) Consider a model for firm profitability in a particular industry (say, automobile), w…
A: Since you have asked multiple question, we will solve the first question for you. If you want any…
Q: The first 100 students entering the Library July 17th of this year approximates the proportion of…
A: We have to find out a data is peramter or a statastics...
Q: 9.2 (±0.4) × ([5.4(±0.3) × 10-³] + [5.6 (±0.1) × 10-³]) absolute uncertainty: .005 percent relative…
A: First add the given expression. Given=…
Q: Population Pyramid is a graphical presentation of the age and sex composition of the population. It…
A: Given statement about the four stages of Population Pyramid.
Q: 4. The output of a machine in 300hp based from the manutacturing manual. You would like to know…
A: For the given, research background, we need to find its Probability Evaluation, Null…
Q: State the null hypothesis and the alternative hypothesis for this situation: "The level of a…
A: Testing of hypothesis is the test by which we decide how far the prior guess is accurate. A null…
Q: City B City C City D City E 20 City A City F 50 km 20 19% 213 223 218 100 km 195 20 20% 21% 213 22%
A: Solution: Let X be the growth rate within 50km and Y be the growth rate within 100km. From the given…
Q: 5. Pond's Age-Defying Complex, a cream with alpha-hydroxy acid, advertises that it can reduce…
A: Introduction: The parameter, or population characteristic of interest in the study is the proportion…
Q: Otitis media is a disease that occurs frequently in the first few years of life and is one of the…
A: Here it is given that , the number of infants of 2500 infants who were first seen at birth who…
Q: b. Which of the two suppliers would you recommend to the factory? Provide the reasons behind your…
A: b) supplier 2
Q: An experiment was performed in chemical engineering in order to investigate the conditions most…
A: From the given information, the multiple-regression model fitted to the data is, y = -130.7+ 0.134…
Q: Nexium is a drug that can be used to reduce the acid produced by the body and heal damage to the…
A: a) Population: A ‘population’ is defined as a set or collection of all the individual persons,…
Q: A study was done to investigate the relationship between amount of protix (a new…
A: Procedure for Scatter plot in excel: Step1: Select the data. Step 2: Select Insert. Step 3: In the…
Q: Table 11.30 Relationship between weight change and change in HgbA1c among diabetic boys 1st visit…
A: Since we only answer up to 3 sub-parts, we’ll answer the first 3. Please resubmit the question and…
Q: Poverty and Dietary Calcium. Calcium is the most abundant mineral in the human body and has several…
A: In this case, consider the distribution of the calcium intakes of adults with incomes below the…
Q: 1. One difference between ANOVA and regression is: a) ANOVA is for statistical inference, whereas…
A: Difference between ANOVA and regression is
Q: a) ANOVA is for statistical inference, whereas regression is not b) a regression line accounts for…
A: Regression analysis is a technique in which the dependent variable is predicted from a set of…
Q: In a certain jurisdiction, all students in Grade Three are required to take a standardized test to…
A: By , observing the above scatter plot we see that there is a strong negative relationship…
Q: 1. Parking at a large university can be extremely difficult at times. One particular university is…
A: Parameter: The statistical measure that describes the features of the population is termed as a…
Q: Carbon dioxide is known to have a critical effect on microbiological growth. Small amounts of CO2…
A: According to the provided data, a study is conducted to investigate the effect of CO2 on the growth…
Q: Lemons and Car Crashes Listed below are annual data for various years. The data are weights (metric…
A: Lemon Imports 230 265 358 480 530 Crash Fatality Rate 15.9 15.7…
Q: Now complete the chi-square test to determine if the Hardy-Weinberg equilibrium has been violated,…
A: Null hypothesis: there is no significant difference between observed and expected frequencies. sum…
Q: Incidence rate in the last influenza epidermic was found to be 50 per thousand (5) of the population…
A: Given :p = 0.05 q = 1-p = 0.95 Let, n=4pqE2 Where, E = Allowable error. Here, E = 0.005 and 0.01
Q: 2. To investigate the effect of pH and catalyst concentration on product viscosity (cSt). Two levels…
A: Given:
Q: 7. The Phillips curve is a relationship between the inflation rate (inf) and the unemployment rate…
A: “Since you have asked multiple question, we will solve the first question for you. If you want any…
Q: Thomas and Camille are international visiting scientists with research interests in horticultural…
A: Use the given table to determine the correlation coefficient:…
Q: George conducted an experiment to find relation between consuming alcohol and sleep disturbance and…
A: Hey there! Thank you for posting the question. Since there are multiple questions posted, we will…
Q: Q5: Serum digoxin levels were determined for nine healthy males aged 20-45 Pharmacology/ Thi-Qar…
A: State the hypotheses.
Q: Integrated circuits consist of electric channels that are etched onto silicon wafers. A certain…
A: It is given that the population proportion P is 0.05. It is found that 35 of 1,000 circuits show…

Contingency Table
A contingency table can be defined as the visual representation of the relationship between two or more categorical variables that can be evaluated and registered. It is a categorical version of the scatterplot, which is used to investigate the linear relationship between two variables. A contingency table is indeed a type of frequency distribution table that displays two variables at the same time.
Binomial Distribution
Binomial is an algebraic expression of the sum or the difference of two terms. Before knowing about binomial distribution, we must know about the binomial theorem.
23


Trending now
This is a popular solution!

Step by step
Solved in 2 steps with 2 images


- 5. A clinical trial is being conducted in order to determine the efficacy of a new drug that will be used to treat rheumatoid arthritis. The efficacy of the medication will not only be determined by the physical improvement of symptoms but will also be determined by using a blood test to examine the concentration of C-reactive protein (an inflammatory marker) in an individual’s blood. If the researcher wants a margin of error for the level of C-reactive protein to be less than or equal to 2.0 mg/d and if the standard deviation for C-reactive protein concentrations among arthritis patients was previously documented at 7 mg/dL, how many patients should be recruited for each group of individuals in the study, assuming a 95% confidence interval will be used to quantify the mean differences between the control group and the treatment group?A) n for the treatment group = 95 and n for the control group = 95B) n for the treatment group = 48 and n for the control group = 48C) n for the…10) Integrated circuits consist of electric channels that are etched onto silicon wafers. A certain proportion of circuits are defective because of "undercutting", which occurs when too much material is etched away so that the channels, which consist of the unetched portions of the wafers, are too narrow. A redesigned process, involving lower pressure in the etching chamber, is being investigated. The goal is to reduce the rate of undercutting to less than 5%. Out of the first 1000 circuits manufactured by the new process, only 32 show evidence of undercutting. If someone asks you the question "Can you conclude that the goal has been met?", what is the p-value that you'll report? Round the answer to four decimal places.Determine if one-tailed test or two-tailed test fits the given alternative hypothesis. 1. Rexidol and Alaxan FR have the same rate of time of reducing the body pain of patients. Answer: 2. The mean weight of Grade 11 students is less than 55 kilograms. Answer: 3. The enrolment rate of the Elementary school department and secondary school department of ingenium school marikina is not the same. Answer: 4. Male students of an Institution have a higher quotient level of intelligence compare to Female students of the same Institution. Answer: 5. The mean of internet users this year is significantly higher as compared to last year. Answer: (Just put short explanation)
- Promoting population growth is an important policy of an anonymous country, and an equally important issue is to improve its people's health, both physically and spiritually. In relation to this, a problem of considerable interest to the country's health officials as well as to its ordinary people is to understand the effects of smoking during pregnancy on infant health. One typical and convenient measure of infant health is birth weight since a new-born infant who is too light can put the infant at risk for contracting various illnesses. Hence a simple linear regression (SLR) model could be proposed as follows: \[ \text { weight }=\beta_{0}+\beta_{1} \text { ciga }+e, \] (1p) where weight is birth weight in ounces and ciga is average number of cigarettes the mother smoked per day during pregnancy. Using the popular ordinary least squares (OLS) method and the relevant data from BabyWeight - a dataset on some relevant variables or factors compiled from a recently-conducted random survey…a. steady-state value of capital-labor ratio?b. steady-state value of output per worker?c. steady-state value of consumption per worker?Company determines that that the length of life of WPPX model radio is probably normal with µ=12 years and σ=2.5 year A) Lets say this radio company guarantees the radio for 9 years. What % of the radios will have to be replaced... find % of the radios that last less than 9 years? (b) Also lets say the radio company says they are going to replace the bottom 2.5% of the radios. What is thethe length of minimum guarantee period (c) What is the 90th percentile of the length of life of the radio model?
- In a certain jurisdiction, all students in Grade Three are required to take a standardized test to evaluate their math comprehension skills.The file contains these data resulting from a random sample of n=30 schools within this jurisdiction. From these data you wish to estimate the model Yi=β0+β1Xi+ei where Xi is the percentage of Grade Three students in School i who live below the poverty line and Yi is the average mathematics comprehension score for all Grade Three students in the same school, School i. The observed data for the X variable is labled perbelowpoverty and the observed data for the Y variable is labeled mathscore in the file.Import (either hand type or load the file) data into R Studio, then answer the following questions based on the data.(a) Create a scatterplot of the data. What can you say about the nature of the relationship between the percentage of Grade Three students living below the poverty line in a certain school and the school's average Grade Three…DiabetesA group of 10-year-old boys were first ascertained in acamp for diabetic boys. They had their weight measuredat baseline and again when they returned to camp 1 yearlater. Each time, a serum sample was obtained from whicha determination of hemoglobin A1c (HgbA1c) was made.HgbA1c (also called glycosylated hemoglobin) is routinelyused to monitor compliance with taking insulin injections.Usually, the poorer the compliance, the higher the HgbA1clevel will be. The hypothesis is that the level HgbA1c isrelated to weight. The data in Table 11.28 were obtained. **5 Compute a rank correlation between change inweight and change in HgbA1c, each over 1 year. Use this measure to directly test the hypothesis that change in weight over 1 year is related to change in HgbA1c. Report a two-tailed p-value, and provide a 95% confidence interval for the underlying rank correlationDiabetesA group of 10-year-old boys were first ascertained in acamp for diabetic boys. They had their weight measuredat baseline and again when they returned to camp 1 yearlater. Each time, a serum sample was obtained from whicha determination of hemoglobin A1c (HgbA1c) was made.HgbA1c (also called glycosylated hemoglobin) is routinelyused to monitor compliance with taking insulin injections.Usually, the poorer the compliance, the higher the HgbA1clevel will be. The hypothesis is that the level HgbA1c isrelated to weight. The data in Table 11.28 were obtained.11.92 What test can be performed to assess the relationship between weight and HgbA1c at the initial visit?11.93 Please perform the test in Problem 11.92, and reporta two-tailed p-value.11.94 Do the results in Problem 11.93 imply a relationshipbetween change in HgbA1c and change in weight for anindividual boy? Why or why not?11.95 Compute a rank correlation between change inweight and change in HgbA1c, each over 1 year. Use this…
- The records of a state-owned company indicate that of all vehicles undergoing emissions testing during the previous year, 70% passed on the first test. A random sample of 200 cars tested in the country during the current year reveals that 62% passed the initial test. Does this data suggest that the true proportion for this country is less than the previous countrywide proportion? Test the relevant hypothesis at the 5% level of significance. (d) Determine the critical region(s) for this test. (e) State the conclusion of this test. Give a reason for your answer.Poverty and Dietary Calcium. Calcium is the most abundant mineral in the human body and has several important functions. Recommendations for calcium are provided in Dietary Reference Intakes, developed by the Institute of Medicine of the National Academy of Sciences. The recommended adequate intake (RAI) of calcium for adults (ages 19–50) is 1000 milligrams (mg) per day. If adults with incomes below the poverty level have a mean calcium intake equal to the RAI, what percentage of all samples of 18 such adults have mean calcium intakes of at most 947.4 mg? Assume that σ = 188 mg. State any assumptions that you are making in solving this problem.In a certain jurisdiction, all students in Grade Three are required to take a standardized test to evaluate their math comprehension skills.The attached contains these data resulting from a random sample of n=40 schools within this jurisdiction. From these data you wish to estimate the model Yi=β0+β1Xi+ei where Xi is the percentage of Grade Three students in School i who live below the poverty line and Yi is the average mathematics comprehension score for all Grade Three students in the same school, School i. The observed data for the X variable is labled perbelowpoverty and the obvserved data for the Y variable is labeled mathscore in the .csv file.Import (either hand type or load the file) data into R Studio, then answer the following questions based on the data.(a) Create a scatterplot of the data. What can you say about the nature of the relationship between the percentage of Grade Three students living below the poverty line in a certain school and the school's average Grade Three…
