Major League Baseball (MLB) consists of teams that play in the American League and the National League. MLB collects a wide variety of team and player statistics. Some of the statistics often used to evaluate pitching performance are as follows: ERA: The average number of earned runs given up by the pitcher per nine innings. An earned run is any run that the opponent scores off a particular pitcher except for runs scored as a result of errors. SO/IP: The average number of strikeouts per inning pitched. HR/IP: The average number of home runs per inning pitched.


Major League Baseball (MLB) consists of teams that play in the American League and the National League. MLB collects a wide variety of team and player statistics. Some of the statistics often used to evaluate pitching performance are as follows:
- ERA: The average number of earned runs given up by the pitcher per nine innings. An earned run is any run that the opponent scores off a particular pitcher except for runs scored as a result of errors.
- SO/IP: The average number of strikeouts per inning pitched.
- HR/IP: The average number of home runs per inning pitched.
- R/IP: The number of runs given up per inning pitched.
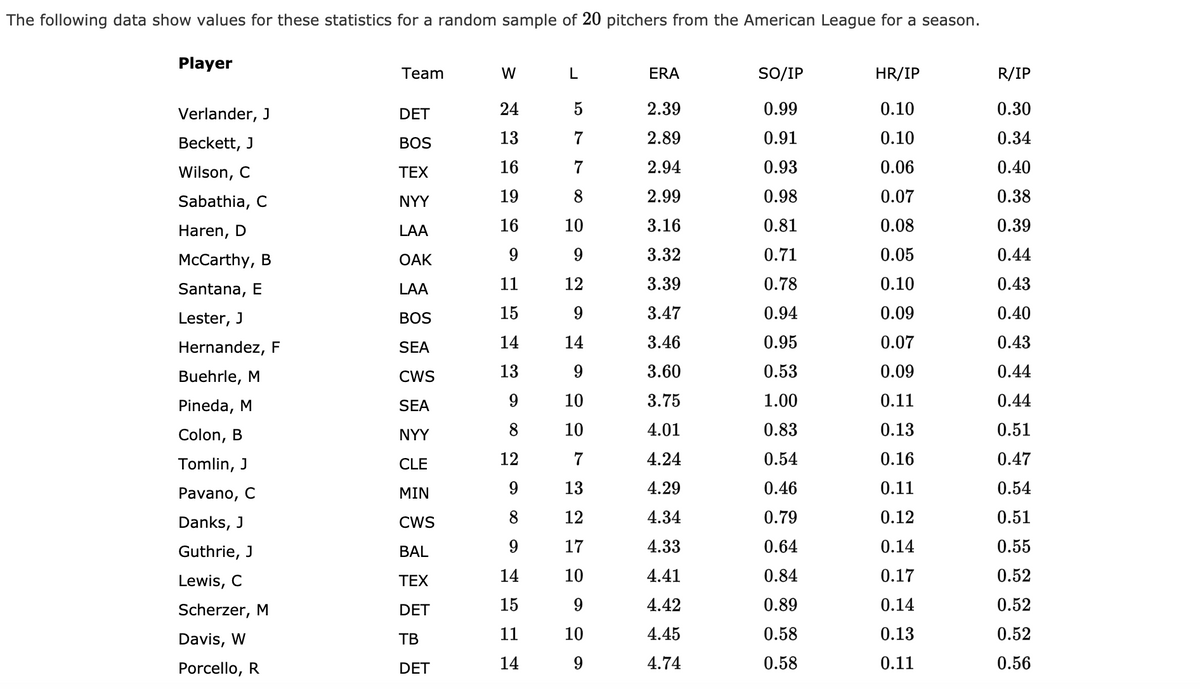
The following data show values for these statistics for a random sample of 20 pitchers from the American League for a season.
(chart attached in image)
a. What are the values of and (to 3 decimals), if the average number of runs is the dependent variable and the average number of strikeouts per inning pitched and the average number of home runs per inning pitched are the independent variables. Enter negative value as negative number.
R/IP= _ + _ SO/IP _ HR/IP
R^2=
R^2a=
b. Does the estimated regression equation provide a good fit to the data? Explain. (to 1 decimal)
The fit is (not bad or bad) , because the nature of the data is able to explain _% of the variability in the number of runs given up per inning pitched.
c. Suppose the earned run average (ERA) is used as the dependent variable in part (a) instead of the average number of runs given up per inning pitched. What are the values of R^2 and R^2a ? (to 3 decimals). Enter negative value as negative number.
ERA= _ + _ SO/IP _ + _ HR/IP
R^2=
R^2a=
Does the estimated regression equation provide a good fit to the data? Explain (to 1 decimal)
The fit is (bad/not bad) because the nature of the data is able to explain _% of the variability in the ERA
Does the estimated regression equation provide a good fit to the data? Explain. (to 1 decimal)
The fit is , because the nature of the data is able to explain of the variability in the ERA.


Trending now
This is a popular solution!

Step by step
Solved in 2 steps with 2 images


