Male BMI Female BMI Given in the table are the BMI statistics for random samples of men and women. Assume that the two samples are independent simple u random samples selected from normally distributed populations, and do not assume that the population standard deviations are equal. Complete parts (a) and (b) below. Use a 0.01 significance level for both parts. H1 H2 n 49 49 24.3872 4.123751 27.3328 s 8.509152 vynat are tne nuii ang aiternative nypotneses ? O A. Ho H1- H2 H: H1 # H2 O B. Ho: H1 =H2 H1: H1> H2 O C. Ho H1#µ2 H: H1
Male BMI Female BMI Given in the table are the BMI statistics for random samples of men and women. Assume that the two samples are independent simple u random samples selected from normally distributed populations, and do not assume that the population standard deviations are equal. Complete parts (a) and (b) below. Use a 0.01 significance level for both parts. H1 H2 n 49 49 24.3872 4.123751 27.3328 s 8.509152 vynat are tne nuii ang aiternative nypotneses ? O A. Ho H1- H2 H: H1 # H2 O B. Ho: H1 =H2 H1: H1> H2 O C. Ho H1#µ2 H: H1

Glencoe Algebra 1, Student Edition, 9780079039897, 0079039898, 2018
18th Edition
ISBN:9780079039897
Author:Carter
Publisher:Carter
Chapter10: Statistics
Section10.4: Distributions Of Data
Problem 19PFA

Related questions
Topic Video
Question
100%
Transcribed Image Text:Question Heip
Male BMI Female BMI
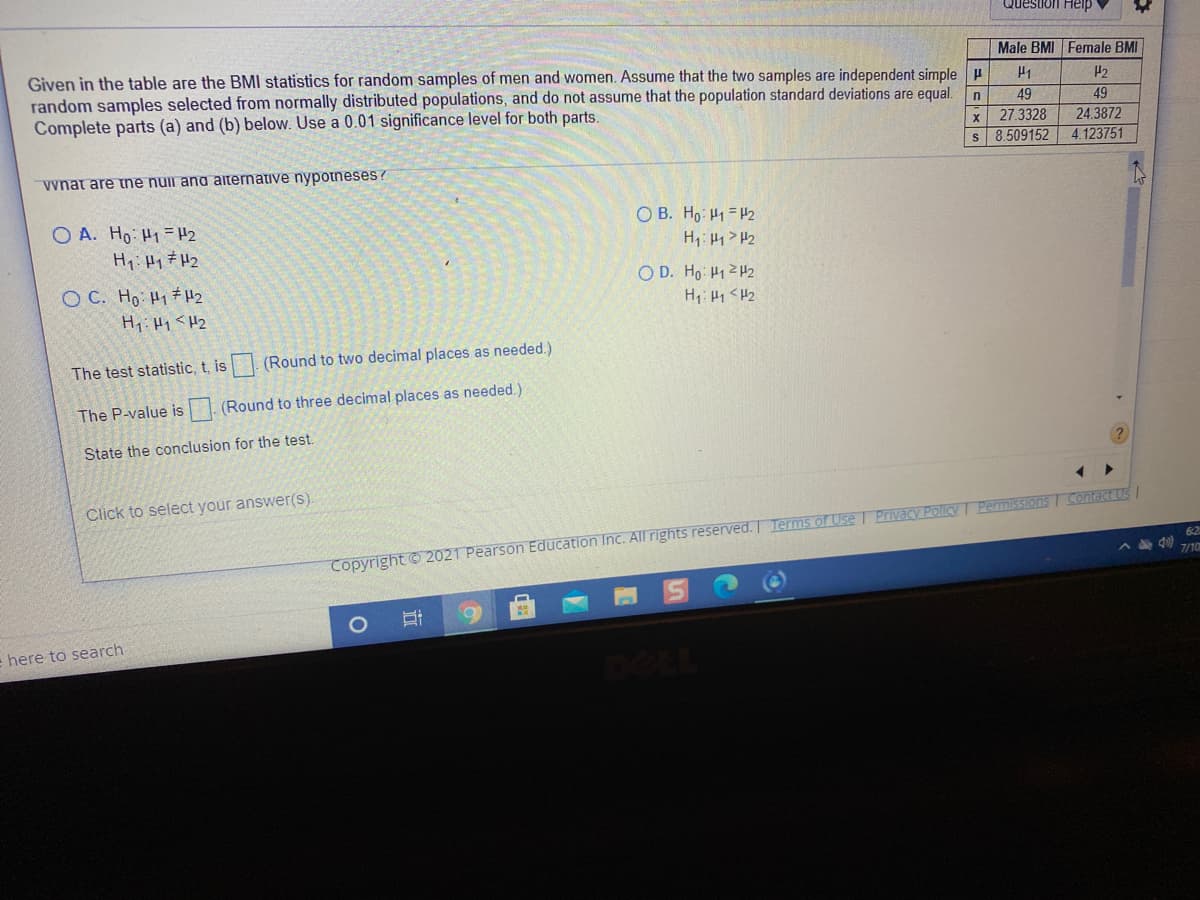
Given in the table are the BMI statistics for random samples of men and women. Assume that the two samples are independent simple H
random samples selected from normally distributed populations, and do not assume that the population standard deviations are equal.
Complete parts (a) and (b) below. Use a 0.01 significance level for both parts.
H1
P2
49
49
27.3328
s 8.509152
24.3872
4.123751
vynat are ne nui ana aiternative nypotneses ?
O B. Ho H1 = H2
H1: H1> H2
O A. Ho: H1= H2
Hy:Hy 7 H2
O D. Ho: 41 2H2
O C. Ho H1#H2
H: H1 < H2
The test statistic, t, is (Round to two decimal places as needed.)
The P-value is
(Round to three decimal places as needed.)
State the conclusion for the test.
Click to select your answer(s).
Permissions I Contact Us
Copyright © 2021 Pearson Education Inc. All rights reserved. Terms of Use I Privacy PolicY!
62
A 40 710
here to search
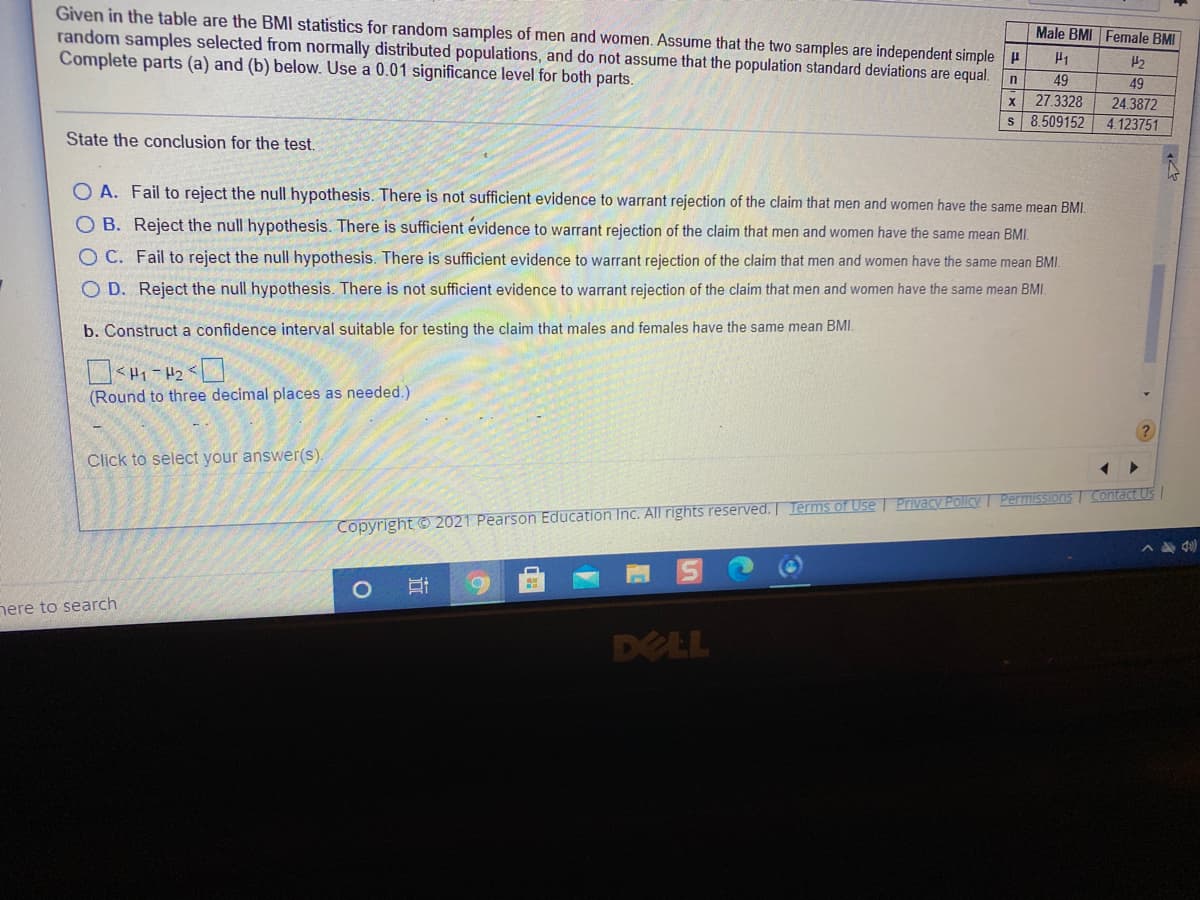
Transcribed Image Text:Given in the table are the BMI statistics for random samples of men and women. Assume that the two samples are independent simple H
random samples selected from normally distributed populations, and do not assume that the population standard deviations are equal.
Complete parts (a) and (b) below. Use a 0.01 significance level for both parts.
Male BMI Female BMI
49
49
24.3872
4.123751
27.3328
s 8.509152
State the conclusion for the test.
O A. Fail to reject the null hypothesis. There is not sufficient evidence to warrant rejection of the claim that men and women have the same mean BMI.
O B. Reject the null hypothesis. There is sufficient evidence to warrant rejection of the claim that men and women have the same mean BMI.
O C. Fail to reject the null hypothesis. There is sufficient evidence to warrant rejection of the claim that men and women have the same mean BMI.
O D. Reject the null hypothesis. There is not sufficient evidence to warrant rejection of the claim that men and women have the same mean BMI.
b. Construct a confidence interval suitable for testing the claim that males and females have the same mean BMI.
(Round to three decimal places as needed.)
Click to select your answer(s)
Copyright © 2021 Pearson Education Inc. All rights reserved. Terms of Use | Privacy Policy Pemissions | Contact Us
nere to search
DELL
近
Expert Solution
This question has been solved!
Explore an expertly crafted, step-by-step solution for a thorough understanding of key concepts.

This is a popular solution!

Trending now
This is a popular solution!

Step by step
Solved in 2 steps with 2 images

Knowledge Booster


Learn more about
Need a deep-dive on the concept behind this application? Look no further. Learn more about this topic, statistics and related others by exploring similar questions and additional content below.Recommended textbooks for you
Glencoe Algebra 1, Student Edition, 9780079039897…
Algebra
ISBN:
9780079039897
Author:
Carter
Publisher:
McGraw Hill
Glencoe Algebra 1, Student Edition, 9780079039897…
Algebra
ISBN:
9780079039897
Author:
Carter
Publisher:
McGraw Hill