Male BMI Fémálé BM Given in the table are the BMI statistics for random samples of men and women. Assume that the two samples are independent simple random samples selected from normally distributed populations, and do not assume that the population standard deviations are equal. Complete parts (a) and (b) below. Use a 0.01 significance level for both parts. H1 H2 43 43 27.4337 26.0489 8.899377 4.565353 a. Test the claim that males and females have the same mean body mass index (BMI). What are the null and alternative hypotheses? O A. Ho: H1 7 H2 H1: H1 H2 The test statistic, t, is. (Round to two decimal places as needed.) The P-value is (Round to three decimal places as needed.) State the conclusion for the test. O A. Reject the null hypothesis. There is not sufficient evidence to warrant rejection of the claim that men and women have the same mean BMI. O B. Fail to reject the null hypothesis. There is not sufficient evidence to warrant rejection of the claim that men and women have the same mean BMI. O C. Fail to reject the null hypothesis. There is sufficient evidence to warrant rejection of the claim that men and women have the same mean BMI. O D. Reject the null hypothesis. There is sufficient evidence to warrant rejection of the claim that men and women have the same mear BMI. b. Construct a confidence interval suitable for testing the claim that males and females have the same mean BMI. (Round to three decimal places as needed.) Does the confidence interval support the conclusion of the test? V because the confidence interval contains
Male BMI Fémálé BM Given in the table are the BMI statistics for random samples of men and women. Assume that the two samples are independent simple random samples selected from normally distributed populations, and do not assume that the population standard deviations are equal. Complete parts (a) and (b) below. Use a 0.01 significance level for both parts. H1 H2 43 43 27.4337 26.0489 8.899377 4.565353 a. Test the claim that males and females have the same mean body mass index (BMI). What are the null and alternative hypotheses? O A. Ho: H1 7 H2 H1: H1 H2 The test statistic, t, is. (Round to two decimal places as needed.) The P-value is (Round to three decimal places as needed.) State the conclusion for the test. O A. Reject the null hypothesis. There is not sufficient evidence to warrant rejection of the claim that men and women have the same mean BMI. O B. Fail to reject the null hypothesis. There is not sufficient evidence to warrant rejection of the claim that men and women have the same mean BMI. O C. Fail to reject the null hypothesis. There is sufficient evidence to warrant rejection of the claim that men and women have the same mean BMI. O D. Reject the null hypothesis. There is sufficient evidence to warrant rejection of the claim that men and women have the same mear BMI. b. Construct a confidence interval suitable for testing the claim that males and females have the same mean BMI. (Round to three decimal places as needed.) Does the confidence interval support the conclusion of the test? V because the confidence interval contains

Glencoe Algebra 1, Student Edition, 9780079039897, 0079039898, 2018
18th Edition
ISBN:9780079039897
Author:Carter
Publisher:Carter
Chapter10: Statistics
Section10.4: Distributions Of Data
Problem 19PFA

Related questions
Topic Video
Question
Transcribed Image Text:Male BMI Female BMI
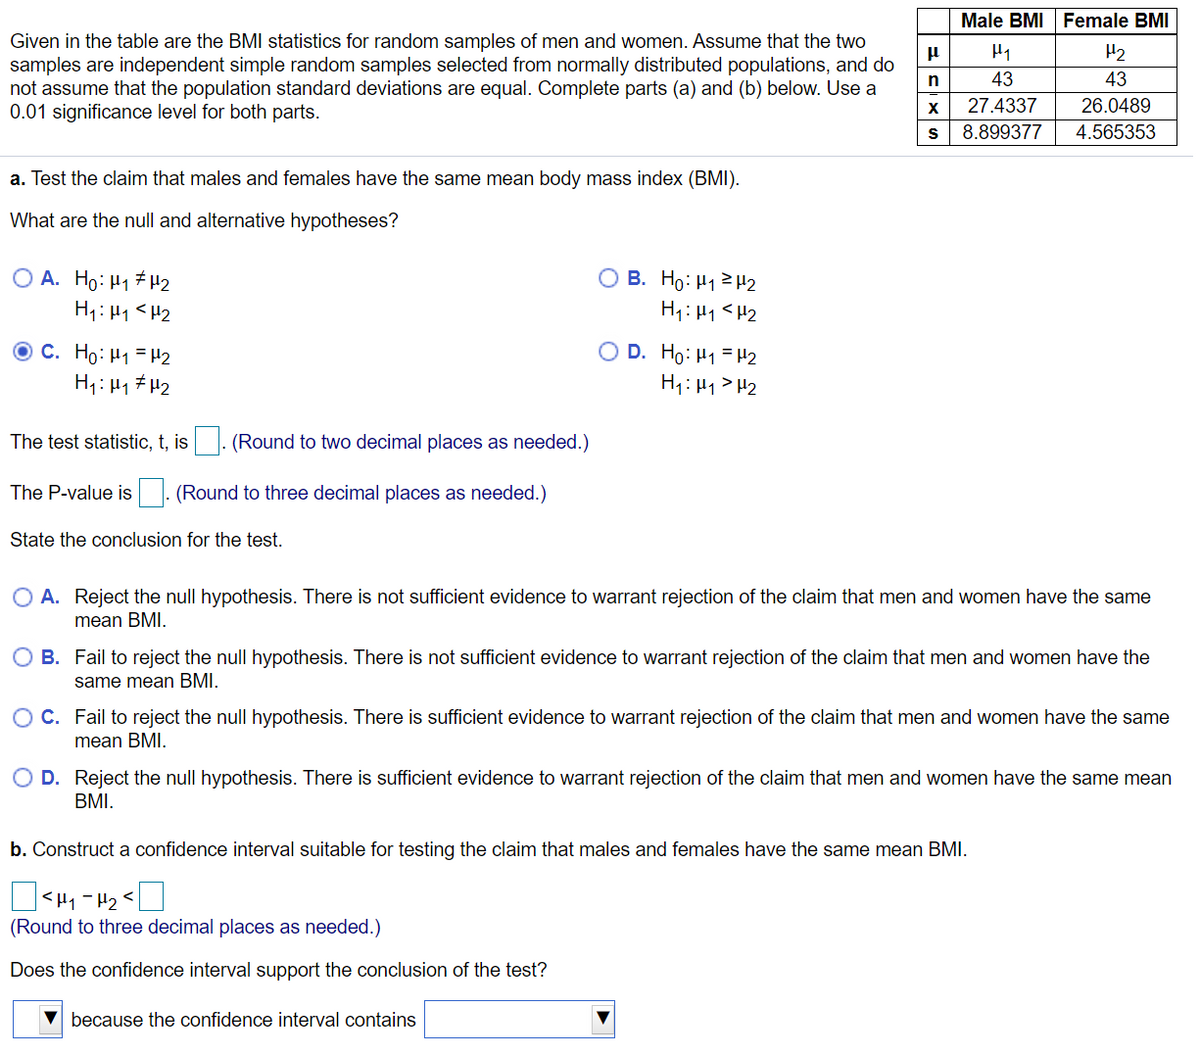
Given in the table are the BMI statistics for random samples of men and women. Assume that the two
samples are independent simple random samples selected from normally distributed populations, and do
not assume that the population standard deviations are equal. Complete parts (a) and (b) below. Use a
0.01 significance level for both parts.
H2
n
43
43
27.4337
26.0489
8.899377
4.565353
a. Test the claim that males and females have the same mean body mass index (BMI).
What are the null and alternative hypotheses?
O A. Ho: H1 7 H2
H1: H1<H2
O B. Ho: H12H2
H1: H1<H2
C. Ho: H1 = H2
H1: 41 # H2
D. Ho: H1 = H2
H1:41>H2
The test statistic, t, is
(Round to two decimal places as needed.)
The P-value is |. (Round to three decimal places as needed.)
State the conclusion for the test.
O A. Reject the null hypothesis. There is not sufficient evidence to warrant rejection of the claim that men and women have the same
mean BMI.
B. Fail to reject the null hypothesis. There is not sufficient evidence to warrant rejection of the claim that men and women have the
same mean BMI.
C. Fail to reject the null hypothesis. There is sufficient evidence to warrant rejection of the claim that men and women have the same
mean BMI.
O D. Reject the null hypothesis. There is sufficient evidence to warrant rejection of the claim that men and women have the same mean
BMI.
b. Construct a confidence interval suitable for testing the claim that males and females have the same mean BMI.
(Round to three decimal places as needed.)
Does the confidence interval support the conclusion of the test?
because the confidence interval contains
Expert Solution
This question has been solved!
Explore an expertly crafted, step-by-step solution for a thorough understanding of key concepts.

This is a popular solution!

Trending now
This is a popular solution!

Step by step
Solved in 4 steps with 3 images

Knowledge Booster


Learn more about
Need a deep-dive on the concept behind this application? Look no further. Learn more about this topic, statistics and related others by exploring similar questions and additional content below.Recommended textbooks for you
Glencoe Algebra 1, Student Edition, 9780079039897…
Algebra
ISBN:
9780079039897
Author:
Carter
Publisher:
McGraw Hill
Glencoe Algebra 1, Student Edition, 9780079039897…
Algebra
ISBN:
9780079039897
Author:
Carter
Publisher:
McGraw Hill