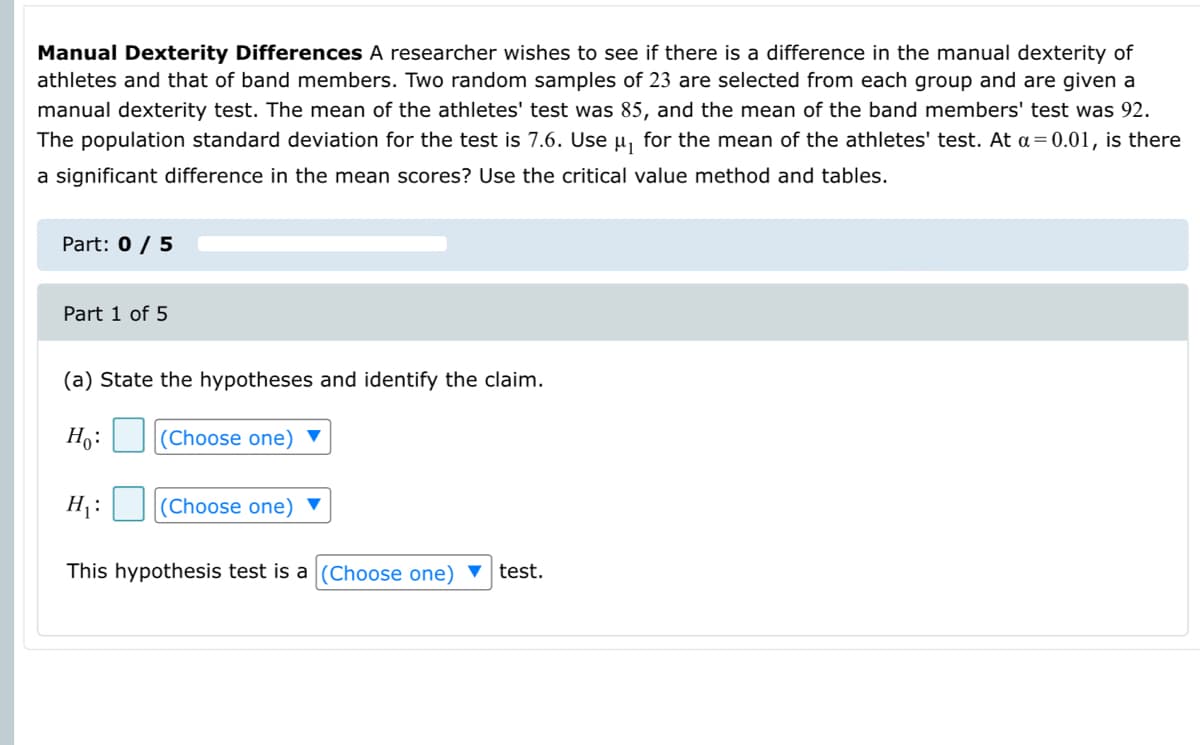
Manual Dexterity Differences A researcher wishes to see if there is a difference in the manual dexterity of athletes and that of band members. Two random samples of 23 are selected from each group and are given a manual dexterity test. The mean of the athletes' test was 85, and the mean of the band members' test was 92. The population standard deviation for the test is 7.6. Use µ, for the mean of the athletes' test. At a= 0.01, is there a significant difference in the mean scores? Use the critical value method and tables. Part: 0/ 5 Part 1 of 5 (a) State the hypotheses and identify the claim. Ho: |(Choose one) ▼ H : (Choose one) ▼ This hypothesis test is a (Choose one) v test.
Manual Dexterity Differences A researcher wishes to see if there is a difference in the manual dexterity of athletes and that of band members. Two random samples of 23 are selected from each group and are given a manual dexterity test. The mean of the athletes' test was 85, and the mean of the band members' test was 92. The population standard deviation for the test is 7.6. Use µ, for the mean of the athletes' test. At a= 0.01, is there a significant difference in the mean scores? Use the critical value method and tables. Part: 0/ 5 Part 1 of 5 (a) State the hypotheses and identify the claim. Ho: |(Choose one) ▼ H : (Choose one) ▼ This hypothesis test is a (Choose one) v test.

Glencoe Algebra 1, Student Edition, 9780079039897, 0079039898, 2018
18th Edition
ISBN:9780079039897
Author:Carter
Publisher:Carter
Chapter10: Statistics
Section10.3: Measures Of Spread
Problem 26PFA

Related questions
Question
The first pic is the question. Since some tutors have been solving the problems wrong recently (no judgment), I’ve added a sample question to solve problem.
Transcribed Image Text:Sample Question
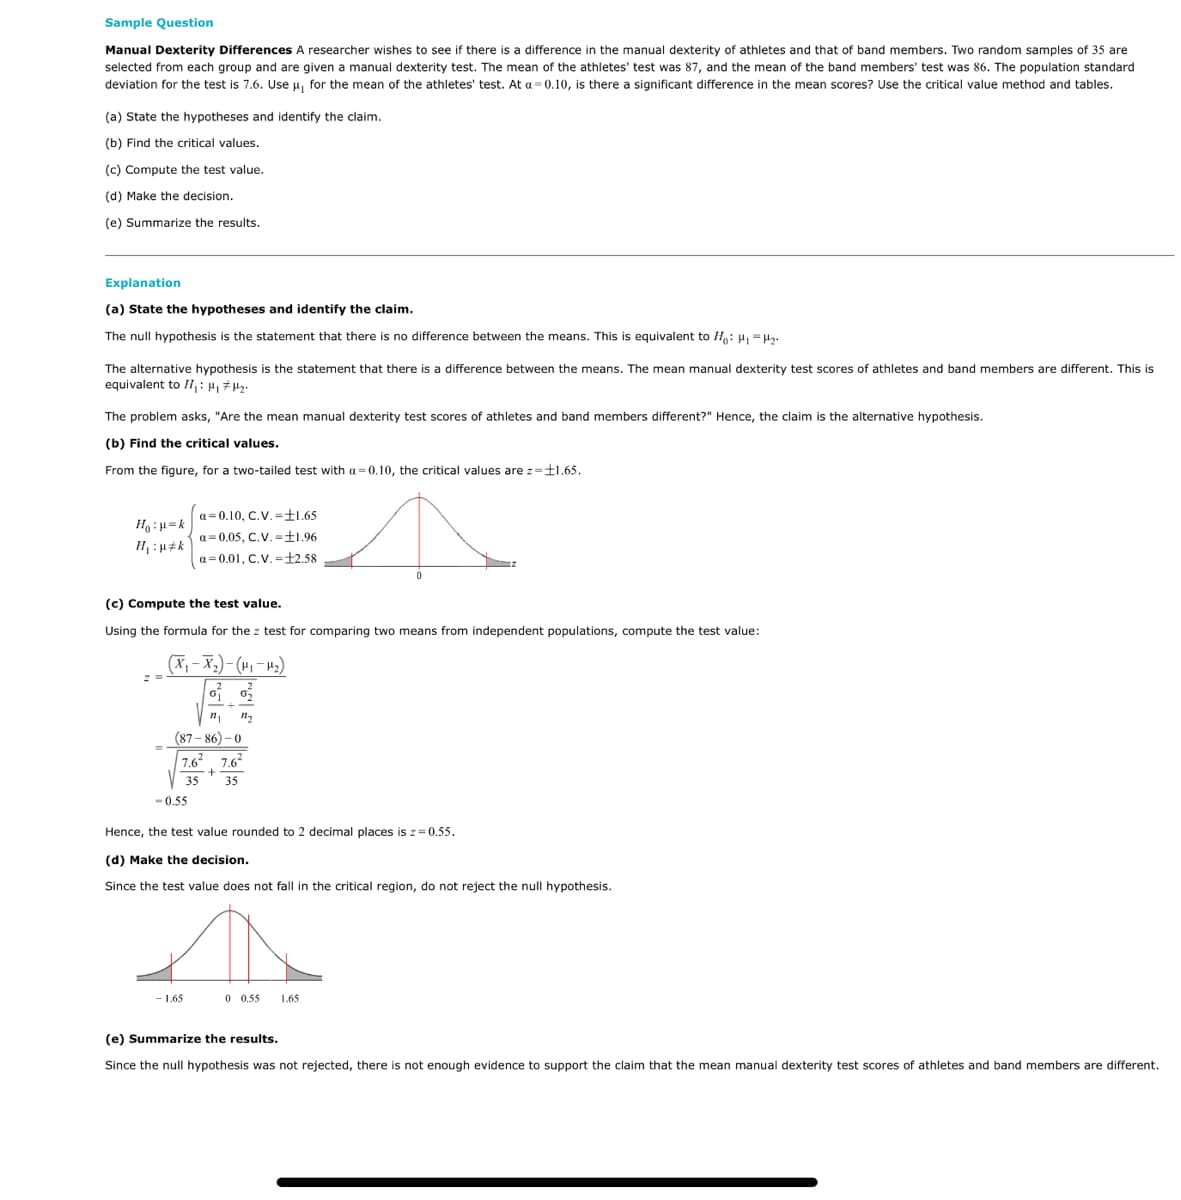
Manual Dexterity Differences A researcher wishes to see if there is a difference in the manual dexterity of athletes and that of band members. Two random samples of 35 are
selected from each group and are given a manual dexterity test. The mean of the athletes' test was 87, and the mean of the band members' test was 86. The population standard
deviation for the test is 7.6. Use u, for the mean of the athletes' test. At a = 0.10, is there a significant difference in the mean scores? Use the critical value method and tables.
(a) State the hypotheses and identify the claim.
(b) Find the critical values.
(c) Compute the test value.
(d) Make the decision.
(e) Summarize the results.
Explanation
(a) State the hypotheses and identify the claim.
The null hypothesis is the statement that there is no difference between the means. This is equivalent to H: H, =H,.
The alternative hypothesis is the statement that there is a difference between the means. The mean manual dexterity test scores of athletes and band members are different. This is
equivalent to I,: -
The problem asks, "Are the mean manual dexterity test scores of athletes and band members different?" Hence, the claim is the alternative hypothesis.
(b) Find the critical values.
From the figure, for a two-tailed test with a= 0.10, the critical values are z=±1.65.
a= 0.10, C.V.=±1.65
a= 0.05, C.V.=±1.96
a=0.01, C.V. =±2,58
(c) Compute the test value.
Using the formula for the z test for comparing two means from independent populations, compute the test value:
(X,- X,)- (H1 - H2)
(87 - 86) – 0
%3D
7.6. 7.6
35
35
- 0.55
Hence, the test value rounded to 2 decimal places is z= 0.55.
(d) Make the decision.
Since the test value does not fall in the critical region, do not reject the null hypothesis.
- 1.65
0 0,55
1.65
(e) Summarize the results.
Since the null hypothesis was not rejected, there is not enough evidence to support the claim that the mean manual dexterity test scores of athletes and band members are different.
Transcribed Image Text:Manual Dexterity Differences A researcher wishes to see if there is a difference in the manual dexterity of
athletes and that of band members. Two random samples of 23 are selected from each group and are given a
manual dexterity test. The mean of the athletes' test was 85, and the mean of the band members' test was 92.
The population standard deviation for the test is 7.6. Use µ, for the mean of the athletes' test. At a=0.01, is there
a significant difference in the mean scores? Use the critical value method and tables.
Part: 0 / 5
Part 1 of 5
(a) State the hypotheses and identify the claim.
Ho: (Choose one)
H:
(Choose one) ▼
This hypothesis test is a (Choose one) ▼ test.
Expert Solution
This question has been solved!
Explore an expertly crafted, step-by-step solution for a thorough understanding of key concepts.

This is a popular solution!

Trending now
This is a popular solution!

Step by step
Solved in 3 steps

Recommended textbooks for you
Glencoe Algebra 1, Student Edition, 9780079039897…
Algebra
ISBN:
9780079039897
Author:
Carter
Publisher:
McGraw Hill
Glencoe Algebra 1, Student Edition, 9780079039897…
Algebra
ISBN:
9780079039897
Author:
Carter
Publisher:
McGraw Hill