The table available below is the frequency distribution for data of the verbal IQ scores for a group of children with low levels of measured lead in their blood. Use the frequen to construct a histogram. Use class midpoint values for the horizontal scale. Do the IQ scores appear to have a normal distribution? E Click the icon to view the frequency distribution of the verbal IQ scores. Which histogram below shows the data? O A. 30- 25 20- 54.5 54.5 64.5 74.5 84.5 94.5 104.5 114.5 124.5 54.5 64.5 74.5 84.5 94.5 104.5 114.5 124.5 IQ (Verbal) IQ (Verbal) Aouanbau B. ㅇ Aouanbau
The table available below is the frequency distribution for data of the verbal IQ scores for a group of children with low levels of measured lead in their blood. Use the frequen to construct a histogram. Use class midpoint values for the horizontal scale. Do the IQ scores appear to have a normal distribution? E Click the icon to view the frequency distribution of the verbal IQ scores. Which histogram below shows the data? O A. 30- 25 20- 54.5 54.5 64.5 74.5 84.5 94.5 104.5 114.5 124.5 54.5 64.5 74.5 84.5 94.5 104.5 114.5 124.5 IQ (Verbal) IQ (Verbal) Aouanbau B. ㅇ Aouanbau

Glencoe Algebra 1, Student Edition, 9780079039897, 0079039898, 2018
18th Edition
ISBN:9780079039897
Author:Carter
Publisher:Carter
Chapter4: Equations Of Linear Functions
Section4.5: Correlation And Causation
Problem 15PPS

Related questions
Question
70 abs 71 solve both plz
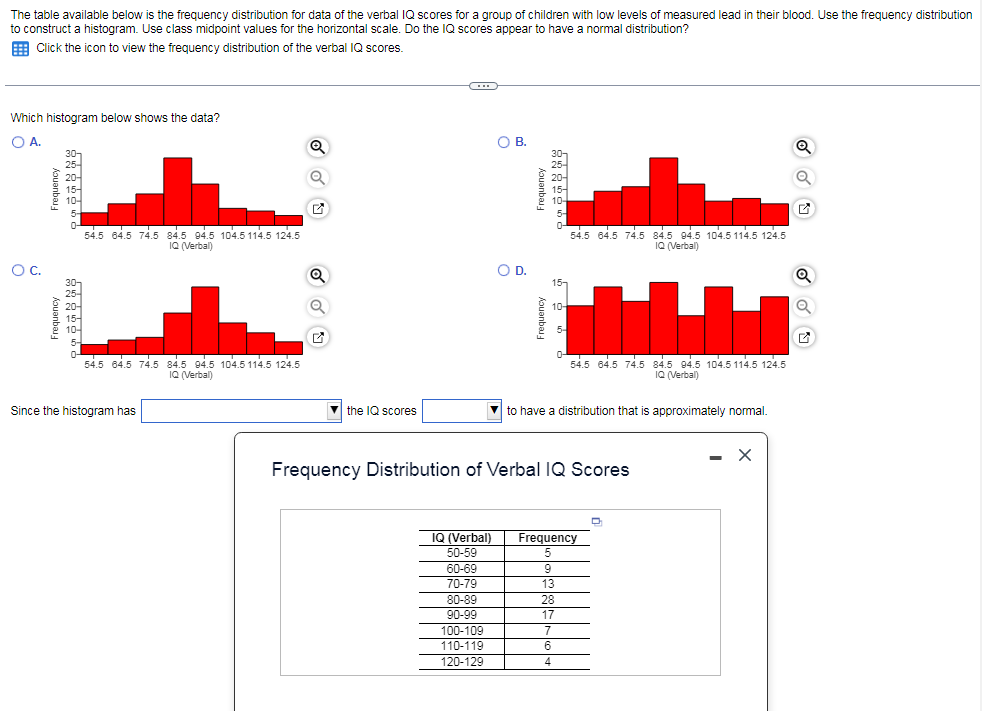
Transcribed Image Text:The table available below is the frequency distribution for data of the verbal IQ scores for a group of children with low levels of measured lead in their blood. Use the frequency distribution
to construct a histogram. Use class midpoint values for the horizontal scale. Do the IQ scores appear to have a normal distribution?
E Click the icon to view the frequency distribution of the verbal IQ scores.
Which histogram below shows the data?
OA.
OB.
Q
30-
30,
5
0-
0-
54.5 64.5 74.5 84.5 94.5 104.5 114.5 124.5
54.5 64.5 74.5 84.5 94.5 104.5 114.5 124.5
1Q (Verbal)
IQ (Verbal)
OC.
Q
OD.
30,
25-
15-
10-
10-
5-
0-
54.5 64.5 74.5 84.5 94.5 104.5 114.5 124.5
54.5 64.5 74.5 84.5 94.5 104.5 114.5 124.5
IQ (Verbal)
IQ (Verbal)
Since the histogram has
the IQ scores
to have a distribution that is approximately normal.
Frequency Distribution of Verbal IQ Scores
IQ (Verbal
50-59
Frequency
60-69
70-79
9
13
80-89
90-99
100-109
28
17
7
110-119
6.
120-129
4
Jouanbaj
ouanba
houanbau
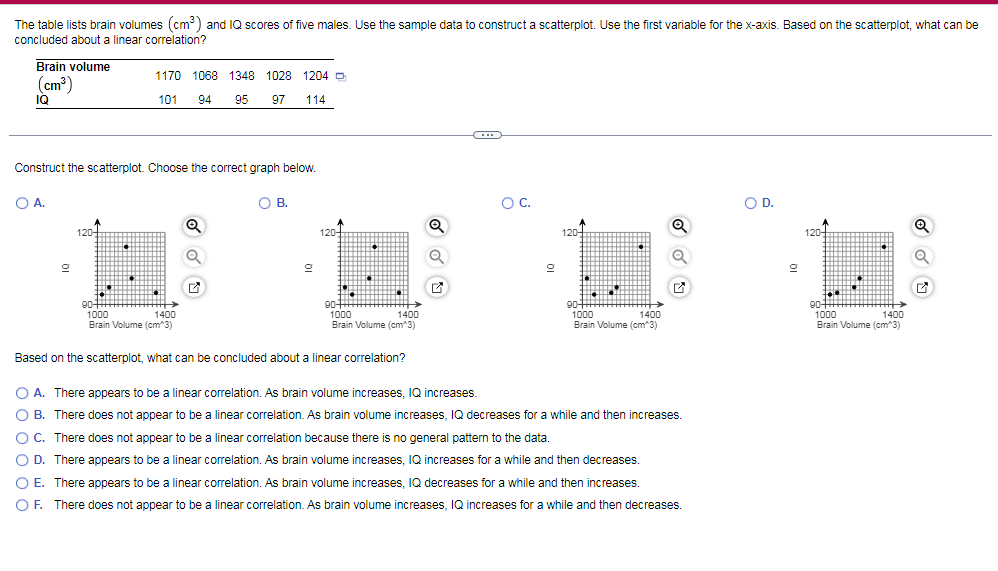
Transcribed Image Text:The table lists brain volumes (cm) and IQ scores of five males. Use the sample data to construct a scatterplot. Use the first variable for the x-axis. Based on the scatterplot, what can be
concluded about a linear correlation?
Brain volume
(cm³)
IQ
1170 1068 1348 1028 1204 D
101
94
95
97
114
Construct the scatterplot. Choose the correct graph below.
OA.
OB.
OC.
OD.
Q
120-
120-
120-
120-
an-1
90
1000
90
1000
90
1000
Brain Volume (cm"3)
90
1000
1400
1400
Brain Volume (cm 3)
1400
1400
Brain Volume (cm 3)
Brain Volume (cm"3)
Based on the scatterplot, what can be concluded about a linear correlation?
O A. There appears to be a linear correlation. As brain volume increases, lIQ increases.
O B. There does not appear to be a linear correlation. As brain volume increases, IQ decreases for a while and then increases.
O C. There does not appear to be a linear correlation because there is no general pattern to the data.
O D. There appears to be a linear correlation. As brain volume increases, IQ increases for a while and then decreases.
O E. There appears to be a linear correlation. As brain volume increases, IQ decreases for a while and then increases.
O F. There does not appear to be a linear correlation. As brain volume increases, IQ increases for a while and then decreases.
Expert Solution
This question has been solved!
Explore an expertly crafted, step-by-step solution for a thorough understanding of key concepts.

This is a popular solution!

Trending now
This is a popular solution!

Step by step
Solved in 2 steps

Recommended textbooks for you
Glencoe Algebra 1, Student Edition, 9780079039897…
Algebra
ISBN:
9780079039897
Author:
Carter
Publisher:
McGraw Hill

Big Ideas Math A Bridge To Success Algebra 1: Stu…
Algebra
ISBN:
9781680331141
Author:
HOUGHTON MIFFLIN HARCOURT
Publisher:
Houghton Mifflin Harcourt
Glencoe Algebra 1, Student Edition, 9780079039897…
Algebra
ISBN:
9780079039897
Author:
Carter
Publisher:
McGraw Hill
Big Ideas Math A Bridge To Success Algebra 1: Stu…
Algebra
ISBN:
9781680331141
Author:
HOUGHTON MIFFLIN HARCOURT
Publisher:
Houghton Mifflin Harcourt