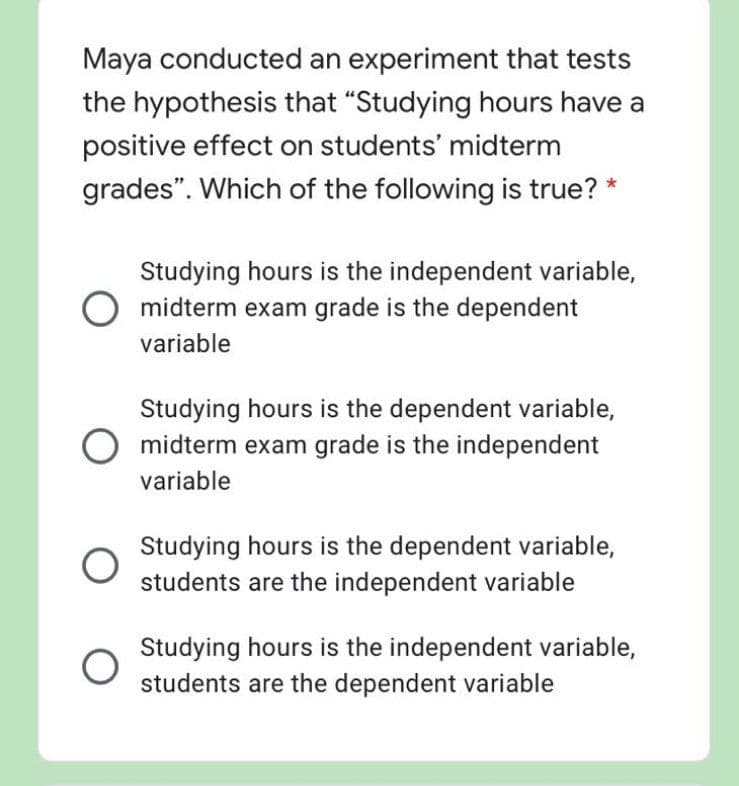
Maya conducted an experiment that tests the hypothesis that "Studying hours have a positive effect on students' midterm grades". Which of the following is true?


Q: Let X= Ucy) out of standard er dere d unierm and Y= Uc5) out of
A: From the given information, X=U(4) out of 8 standard ordered uniform and Y=U(5) out of 8 standard…
Q: 1. Critical value approach. Fill in the blanks in the table below. Test Statistic Significance Level…
A: As per bartleby guideline expert have to answer first question only dear student please upload other…
Q: 3. What percentage of College students have made at least one online purchase in the last three…
A:
Q: ubjecting them to various tests. The results from the most recent random sample of ropes are shown…
A: Given that Sample sizes n1=15 , n2=30 Sample means X̄1=7083 , X̄2=7014 s1 =435…
Q: researcher collected 2000 blood samples from a population, hoping to check out the positive rate of…
A:
Q: (Use T for true and F for false in your answers) Use this truth table to answer questions a), b)…
A: The truth table is based on the logical operators. Logical operators provide the connections to the…
Q: After 4 periods the actual results are collected. The following table documents the forecast and…
A: The number of periods is 4.
Q: You have a panel data set where 545 male workers are observed each year between 1980 and 1987. For…
A: From the above output we see that for the random-effects GLS regression group variable id: Value of…
Q: 6) If 6 computers are selected at random, with replacement, find the probability that: Suppose 15…
A: Given that p=15%=0.15 , q=1-p=1-0.15=0.85 6 computer are selected at random with replacement.…
Q: What do standard deviation, range, and IQR tell us about a data set? O They tell us how many points…
A: What do standard deviation ,range,and IQR tell us about a data set ?
Q: A survey conducted in a small business yielded the results shown in the table. Test the claim that…
A:
Q: et x be a random variable that represents hemogiobin count ((HC) in grams per 100 mi ters of whole…
A: Given : 15 18 15 20 15 12 15 16 17 11 Sample size (n)=10
Q: To estimate the population mean µ with a 85% error margin of 2.5 units, 10) one has determined that…
A:
Q: A fitness club is going to conduct a questionnaire survey from a list of 120 members. Each member is…
A:
Q: ic accidents on highways can be divided into two groups: injured and uninjured. In any given year,…
A: 0.4457 0.3243 0.2223 0.1437 0.0876 0.0504 0.0274 0.0141 0.0069 0.0032 0.0842 0.0576 0.038 0.0242…
Q: ] In a sociological survey, a 1-in-50 systematic sample is drawn from city tax records to determine…
A:
Q: Consider the following sodium content of 26 randomly picked canned food. Propose ropriate data…
A: Given information: Sodium content of 26 randomly picked canned food. MINITAB Procedure: Choose Stat…
Q: In the accompanying display (where both curves are placed on the same number line), which has the…
A: The display shows the normal curves for A and B in same number line.
Q: Teen drivers (those aged 15-19) spend an average of 25 minutes behind the wheel each day. Assume…
A: We have given that, Average or sample mean (x̄) = 25 , population standard deviation (σ) = 7.6 and…
Q: d. What is the probability that her trip will take exactly 50 minutes?
A: here given , The time it takes for Anna to travel between her home and her job is uniformly…
Q: Capsaicin content in red habanero chilli (Capsicum chinense Jacq.) is affected by the drying…
A: Note: Hi there! Thank you for posting the question. As you have posted multiple questions, as per…
Q: The number of sick days taken (per month) by 200 factory workers is summarized below. Number of…
A: First find the relative frequency and tyen add them
Q: During 1 week an overnight delivery company found that the weights of its parcels were normally…
A: Given that ; μ = 16 ounces ? = 4 ounces By using standard normal distribution.
Q: Consider a sample of 8 hypertensive smoking adults. Their serum cholesterol level readings are as…
A:
Q: A drug test correctly gives a positive result 88 percent of the time. However, 3 percent of the…
A: Introduction: Denote X as the event that a person actually has one or more of the drugs in their…
Q: Thefollowing data is from the 2018 National Health Immigrant Survey. Please examine the data and…
A: Chi square test is used to determine whether there is any relationship between two categorical…
Q: Create a standard normal curve for each given, find the areas under the normal curve and shade the…
A:
Q: An experiment was run to determine whether four specific firing temperatures affect the density of…
A: Experiment was run to determine whether the four specific firing temperatures affect the density of…
Q: A person decides to take a vacation and has three places in mind: Las 1) Vegas, London and Paris. He…
A:
Q: A company has collected and smoothened its historical yearly sales data of a product from 2015 up to…
A: The table shows the sales and moving averages.
Q: Alex decides to go to a casino and play his 3 favorite slot machines. He knows from experience that…
A: A probability is likelihood of occurrence of an event.
Q: values for a normal dis 1. x= 13 2. x = 9 3. х%3D23 X : X =
A: As per bartleby guideline expert have to answer first three subparts only.
Q: Find the area under the standard normal curve to the right of z=1.69
A:
Q: II. Create a normal distribution and explain the test scores of the students in each particular…
A:
Q: Q30. Sample mean-11.399 Standard Dev. =13.309 n=991 PE- 11.399 TS-85% CI Alpha= 0.15 Alpha/2=0.075…
A: We have given that Sample mean = 11.399 Standard deviation = 13.309 Sample size n = 991
Q: Practice Exercise No 3 The mean weight of 10 boxes of a certain brand of biscuits is 358 grams,…
A:
Q: Need answers for questions 14, 19 and 21 only please Correlation and Simple Linear Regression V2…
A: Correlation Correlation analysis is a statistical way to determine the association between two…
Q: The following items represent the number of birds observed at a given feeder over the past several…
A:
Q: 5. Customers arrive at coffee shop according to a Poisson process at a mean rate of 5 customers…
A:
Q: Match the following terms to their symbols Sample Standard deviation 1. n Population mean 2. X…
A: We have given the following symbols
Q: Example of negative correlation
A:
Q: 10 11 12 13 14 P(X) 0.4 0.2 0.2 0.10.1
A: Given data,
Q: The numbers of hours worked (per week) by 400 statistics students are shown below. Number of…
A: Given that Number of Hours Frequency 0 ≤ x < 20 10 20 ≤ x < 40 90 40 ≤ x < 60 220…
Q: 0 ≤ x < 10 10 10 ≤ x < 20 100 20 ≤ x < 30 220 30 ≤ x < 40 90 The midpoint…
A:
Q: At a music store in New York City, 68 people entering the store were selected at random and were…
A: For the given data Find a) Determine the empirical probability that the next person entering the…
Q: For the United States, the mean monthly Internet bill is $32.79 per household ICNBC, January 18,…
A: Given that Sample size n =50 sample mean =30.63 Population standard deviation =5.60
Q: A study found that the mean migration distance of the green turtle was 2200 kilometers and the…
A:
Q: The owner of a movie theater company used multiple regression analysis to predict gross revenue (y)…
A: From the given information, the value of SST is 25.9 and the value of SSR is 23.415.
Q: A beverage company did a taste test with their product and their main competitor's leading beverage.…
A: For the given data Find Given that a woman in the taste test is chosen, what is the probability that…
Q: If the readings are 23 4 the variance is-----
A: The question is based on descriptive statistics Given data : 2, 3 and 4

Step by step
Solved in 2 steps

- A researcher wanted to learn more about the relationship between whether or not a student getting less than 8 hours of sleep the night before a test determines whether or not they pass their test the next day. a)What is the explanatory variable in this study? -Whether or not the student passed his/her test -Whether or not a student got less than 8 hours of sleep the night before a test -The number of students who got less than 8 hours of sleep the night before a test -The number of students who passed their test b) What type of relationship is this? -C --> C -Q --> C -Q --> Q -C --> QA researcher has observed 500 vehicles at a stop sign in a suburban neighbourhood and recorded the type of vehicle (sedan, hatchback, bakkie) and driver behaviour at the stop sign (complete stop, near stop, “ran” the stop sign). At the 0.05 level of significance, could there be some relationship between driver behaviour and the type of vehicle being driven? Define the null hypothesis and the alternative hypothesis. A. H1: Driver’s behaviour and type of vehicle are independent vs H0: A relationship exists between driver’s behaviour and type of vehicle B. H0: A relationship exists between driver’s behaviour and type of vehicle vs H1: No relationship exists between driver’s behaviour and type of vehicle C. H0: Driver’s behaviour and dependent on the type of vehicle vs H1: Driver’s behaviour and type of vehicle are independent D. H0: Driver’s behaviour and type of vehicle are independent vs H1: A relationship exists between driver’s behaviour and type of vehicleIn a typical experiment the researcher manipulates the independent or explanatory variable and then observes whether the hypothesized dependent variable is affected by the intervention. Choose any two examples of experiment and describe the independent and dependent variables
- Identify the variable in this test and what type of variable is it (nominal, ordinal or continuous). Then state the null and alternative hypothesis.40 men participating in a study reported how angry they felt at the end of each day for 2 weeks. For the first week 20 of the men were given testosterone supplements and the other 20 were given a placebo. During the 2nd week, the men who were originally given testosterone were switched to the placebo and the men who originally got the placebo were switched to testosterone. What is the dependent variable?What is your variable in this study? State your null hypothesis in words, for this study, and finally state your null hypothesis in symbols for this study.
- In a typical experiment, the researcher manipulates the independent or explanatory variable and then observes whether the hypothesized dependent variable is affected by the intervention. Choose any two examples of experiments and describe the independent and dependent variables.A researcher notes that there seems to be a difference in the prevalence of high cholesterol among individuals who smoke and consume diets high in processed food and the prevalence of high cholesterol among individuals who do not smoke and do not consume diets high in processed foods. Use the appropriate hypothesis to determine if diet and smoking status are related (independent) at the 5%. This is the first step in determining if confounding has influenced the study’s results. Then interpret your response. Diet Low in Processed Foods Normal Cholesterol High Cholesterol Total Non-smoker 124 55 179 Smoker 69 152 221 Total 193 207 400 Diet High in Processed Foods Normal Cholesterol High Cholesterol Total Non-smoker 64 85 149 Smoker 98 153 251 Total 162 238 400 A) The chi square value of 4.65 is higher than the chi square value of 3.84, therefore we can accept H0 at the 5% level and reject…A researcher selects a sample and administers a treatment for anxiety to the individuals in the sample. If the sample is used for a hypothesis test, what does the alternative hypothesis (H1) put forth about the treatment? A. The treatment has no effect on anxiety. B. The treatment adds a constant to each anxiety score. C. The treatment multiplies each anxiety score by a constant. D. The treatment has an effect on anxiety.
- A small clinical pilot study was conducted by a reattach team from Harvard Medical School and the School of Public Health. Fifteen individuals in the early stages of Multiple Sclerosis were fed bovine myelin, a substance containing two antigens thought to be the target of the immune system's attack in Multiple Sclerosis. Another fifteen were given a placebo. In the study, fewer members of the group fed bovine myelin had major attacks of the disease. a.) What is the independent variable? b.) What is the dependent variable? c.) Which group is the treatment group? d.) Which group is the control group? Explain all question.A small clinical pilot study was conducted by a reattach team from Harvard Medical School and the School of Public Health. Fifteen individuals in the early stages of Multiple Sclerosis were fed bovine myelin, a substance containing two antigens thought to be the target of the immune system's attack in Multiple Sclerosis. Another fifteen were given a placebo. In the study, fewer members of the group fed bovine myelin had major attacks of the disease. a.) What is the independent variable? b.) What is the dependent variable? c.) Which group is the treatment group? d.) Which group is the control group Plzz explain all question. Ty.In conducting the t-test for independent means, if you ______, the two means ______. Group of answer choices do not reject the null hypothesis; do not significantly differ from each other do not accept the null hypothesis; are significantly equal to each other reject the null hypothesis; do not significantly differ from each other reject the alternative hypothesis; are significantly different from each other