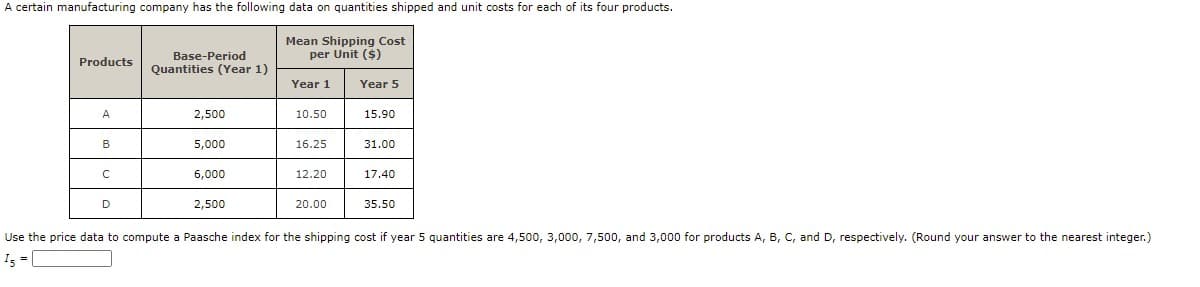
Mean Shipping Cost per Unit ($) Base-Period Quantities (Year 1) Products Year 1 Year 5 A 2,500 10.50 15.90 B 5,000 16.25 31.00 6,000 12.20 17.40 D 2,500 20.00 35.50 Use the price data to compute a Paasche index for the shipping cost if year 5 quantities are 4,500, 3,000, 7,500, and 3,000 for products A, B, C, and D, respectively. (Round your answer to the nearest integer.) 1. =


Q: Stem (hundred thousands) Leaf (ten thousands) 0 667778999 1 02447778889999 2 0011234445667889 3…
A: Given that, From the stem and leaf plot, the house sale prices is given as follows: 60000, 60000,…
Q: Hourly Wage Frequency $10.00 $14.99 8 $15.00 $19.99 5 $20.00 $24.99 3 $25.00 $29.99 1 The table…
A:
Q: A doctor's office staff studied the waiting times for patients who arrive at the office with a…
A:
Q: Genetics, Obstetrics Precise quantification of smoking during pregnancy is difficult in…
A: Let us suppose there are two events and one is connected with the other. Let us suppose that we know…
Q: Quality of Life Experienced by Women and Men (N= 171) WOMEN (n = 74) MEAN (SD) TABLE VI MEN (n= 97)…
A: The sample size used for Women and Men in the given study is 74 and 97. According to the assumptions…
Q: Frequency distribution of cigarette tax rates Tax Rate Frequency 0.00–0.49 0.50–0.99 14 1.00–1.49…
A: Since, the data is grouped. Calculate the middle points for each class interval using the formula:…
Q: ases of Wine Sold at Five Price Levels ses Sold per 10,000 pulation Price per Bottle 23, 21 $10 19,…
A: *Answer:
Q: Stem (hundred thousands) Leaf (ten thousands) 0 667778999 1 02447778889999 2 0011234445667889 3…
A: The stem-and-leaf plot for house sale prices over the last week in City T is given.
Q: Salary (pesos) 1001-2000 2001-3000 12 3001-4000 10 4001-5000 6 5001-6000 Compute the following: a.…
A: As per given table: Salary f Mid value(x) d=x-Ah: A=3500.5 f·d cf 1001-2000 7 1500.5 -2 -14 7…
Q: In a study of claim payment times, you are given: (i) The data were not truncated or censored. (ii)…
A:
Q: Literacy Rates For the same countries used in Exer- cise 22, the literacy rates (in percents) for…
A:
Q: 3. Determine whether the data described are qualitative or quantitative The rate at which your heart…
A: Solution-: (3) The data describe are qualitative or quantitative The rate at which your heart…
Q: Required information Suppose that the table presents detailed information on the volatile compound…
A: Given : Concentration of total easters (in mf/L) in each of the wines Yeast strains (n) =16…
Q: Arsenic in Rice Listed below are measured amounts ( μ g per serving) of arsenic in a sample of…
A: The data is based on the amount of arsenic in the sample of brown rice. The class width is 2µg and…
Q: Ethnicity Number of Cases Percentage of total county population Number of cases expected (round…
A: The chi-square goodness of fit test can be used to determine whether a sample distribution follows…
Q: The accompanying data represent the monthly rate of return of a certain company's common stock for…
A: “Since you have posted a question with multiple sub-parts, we will solve first three subparts for…
Q: Data about recent federal defense spending are given in the accompanying Statistical Abstract of the…
A: We are entitled to solve only 3 subparts at a time so I am providing you the same. Kindly repost the…
Q: Archaeologists can determine the diets of ancient civilizations by measuring the ratio of carbon-13…
A:
Q: end of pregancy. The incident of miscarrige was self-reported if occurred. Compute the population…
A: Introduction - Population attributable Risk PAR=Risk(total pop)-Risk(unexposed)Risk(Total Pop)
Q: Calorie Content (KCAL) Number of Brands (F) Midpoint (M) FM FM2 Cumulative frequency 0<8 3…
A: Comments: As per our company guidelines we are supposed to answer only three subparts. Kindly repost…
Q: Age group Frequency (f) Mid value (x) f*x (f* x )* x 10 - 20 15 45 675 20 - 30 14 25 350 8750 30 40…
A:
Q: Textbook prices have a seasonal structure on Ebay. At the end of a term, the supply of used books…
A: From provided information, textbook prices have a seasonal structure on Ebay. The average price the…
Q: Primary data is a. Always collected before secondary data O b. Usually collected through annual…
A: Primary data is a type of data that is collected by researchers directly from main sources through…
Q: Electric power consumption is measured in kilowatt-hours (kWh). The local utility company offers an…
A: Formula: S.I = (Mean of a particular time period)/(Mean of all time period) Adjusted S.I = S.I =…
Q: 1. As heat is added to a material its temperature rises. The heat capacity is a quantitative…
A:
Q: Mean Range (viscosity Mean Day (sample) Day (sample) Range (viscosity (viscosity (viscosity measure)…
A:
Q: Data about recent federal defense spending are given in the accompanying Statistical Abstract of the…
A: Average yearly rate of change in defence spending from 1990 to 1995 is,…
Q: The accompanying data represent the monthly rate of return of a certain company's common stock for…
A: To determine Quartiles for the given data: Quartiles are partition values which divide the data set…
Q: Percentage ash content in peat moss 0.5 1.8 2.6 3.1 1.1 1.6 1.3 3.0 2.0 3.8 3.2 2.4 3.6 2.4 2.4 2.8…
A: Given data is: 0.5,1.1,2.0,3.6,1.9,1.8,1.6,3.8,2.4,2.3,2.6,1.3,3.2,2.4,1.5,3.1,3.0,2.4,2.8,0.7.…
Q: Drop in U.S. Unemployment 10.5 10.0 9.5- 9.0 8.5 8.0 7.5 Feb March April May June July Aug Sept Oct…
A:
Q: The data in the accompanying table represent the rate of return of a certain company stock for 11…
A: There are two variables which are Rates of return of the index and Rates of return of the company…
Q: Range Demand Frequency Probability Cumulative Lower Higher Demand 10 5% 10 20 10% 20 50 25% 30 40…
A: we have assumed random numbers
Q: snip
A: As per bartleby guidelines only 3 subparts are answered, please upload the rest separately. Average…
Q: The number of pounds of steam used per month by a chemical plant is thought to be related to the…
A: Note: Hi there! Thank you for posting the question. As there are multiple sub parts, according to…
Q: Data about recent federal defense spending are given in the accompanying Statistical Abstract of the…
A: (a) To find the average yearly rate of change in defense spending from 1990 to 1995: r=[D(5)-D(0)]n'…
Q: Hypothetical Data for Unintentional Injuries Men Women Total Injuries Fatal Injuries Nonfatal…
A: Solution Given That, Hypothetical data for unintentional injuries Total injuries Fatal injuries…
Q: a) Median b) 1st Quartile c) 3rd Quartile d) IQR 3.5 2.9 2 0.4 0.16 20 40 60 80 100 Time per week…
A: Data can be raw or grouped, with some pros and cons associated with both of them. The raw data has…
Q: Adjusted Gross Incomes. The Internal Revenue Service (IRS) publishes data on adjusted gross incomes…
A: Note: Since the question is incomplete, we are checking whether the distribution is skewed or not.
Q: onsider the following data. Period…
A: Given: Periods Rate of return (%) 1 -6 2 -8 3 -4 4 2 5 5.4
Q: Question : the commodity data are In Image . Determine (a) Paasche’s price index and Paasche’s…
A: In this case, we need to find Paasche’s price index and Paasche’s quantity index.
Q: **Frequency distribution table** The city council was concerned that allowing more bars within city…
A: The given scores are, 0.05 0.08 0.09 0.12 0.03 0.07 0.09 0.12 0.10 0.06 0.10 0.02 0.08 0.00 0.07…
Q: The weights (in pounds) of 30 newborn babies are listed below. 5.5 5.7 5.8 5.9 6.1…
A:
Q: The attached cost-output data were obtained as part of a study of the economies of scale in…
A: Based on the given data of cost function as a student in average daily attendance, we can see which…
Q: Percentage ash content in peat moss 0.5 1.8 2.6 3.1 1.1 1.6 1.3 3.0 2.0 3.8 3.2 2.4 3.6 2.4 2.4 2.8…
A: We are given the data points. Total no of observations, n=20 0.5 1.8 2.6 3.1 1.1 1.6…
Q: We are making a historical study of the American economy from 1950 to 1980. Data on prices, the…
A: Part a: We compute the index number for prices, the labor force, productivity and the GNP taking…
Q: rpillar’s stock plunged dramatically. Monthly data for Caterpillar’s risk-adjusted return (R − Rf)…
A: The Linear Model is used for representing the R-Rf and Rm-Rf is given as: x Rm-Rf y R-Rf…
Q: Literacy Rates For the same countries used in Exer- cise 22, the literacy rates (in percents) for…
A: The least square regression equation is obtained using EXCEL: Select Data > Data analysis >…
Q: Quality of Life Experienced by Women and Men (N= 171) TABLE VI WOMEN (η74) MEAN (SD) MEN (n = 97)…
A: The mean and standard deviations are used to analyse the continuous variables. A continuous variable…
Q: Stem (hundred thousands) Leaf (ten thousands) 0 667778999 1 02447778889999 2 0011234445667889 3…
A: The stem is given in hundred thousands and leaf is given in ten thousands.For example, Stem Leaf 3…
Q: Stem (hundred thousands) Leaf (ten thousands) 0 667778999 1 02447778889999 2 0011234445667889 3…
A: Stem and leaf plot : It is an interesting way to showcase data. Stem and leaf plot is one of the…

Step by step
Solved in 2 steps with 2 images


- Find out the next month after april income by using the forecasting method of the moving average methodThe prices and the numbers of various items produced by a small machine and stamping plant are reported below. Use 2010 as the base. 2010 2018 Item Price (in $) Quantity Price (in $) Quantity Washer 0.07 17,000 0.10 20,000 Cotter pin 0.04 125,000 0.03 130,000 Stove bolt 0.15 40,000 0.15 42,000 Hex nut 0.08 62,000 0.10 65,000 a. Determine the Laspeyres price index. (Round your answer to 2 decimal places.) b. Determine the Paasche price index. (Round your answer to 2 decimal places.)A certain manufacturing company has the following data on quantities shipped and unit costs for each of its four products. Products Base-PeriodQuantities (Year 1) Mean Shipping Costper Unit ($) Year 1 Year 5 A 2,000 10.50 15.90 B 5,000 16.25 32.00 C 6,500 12.20 16.40 D 2,500 20.00 35.50 Use the price data to compute a Paasche index for the shipping cost if year 5 quantities are 4,500, 3,000, 7,500, and 3,000 for products A, B, C, and D, respectively. (Round your answer to the nearest integer.) I5 = ??
- The demand for hand sanitizers is off the charts due to this coronavirus outbreak. People are in desperate need of hand sanitizers. Therefore, FMCGs like Unilever Bangladesh Limited are producing this life-essential product in a bulk amount to help the citizens across Bangladesh to maintain the hygiene standards. Sales figures and profits for the stores are given in the following table. (For the Unit sales, pick any value in between 12-33Units in ascending order). Unit Sales, X Profit (Taka), Y ** 1200 ** 1650 ** 1950 ** 2300 ** 2700 ** 3600 ** 4100 Obtain a regression line for the data. Calculate the profit of a shop for 40 unit sales. Calculate the correlation between unit sales and profit. What is the coefficient of determination of these variables?Mr. William Profit is studying companies going public for the first time. He is particularly interested in the relationship between the size of the offering and the price per share. A sample of 15 companies that recently went public revealed the following information. Size Price Size Price ($ millions), per Share, ($ millions), per Share, Company x y Company x y 1 9.0 10.8 9 160.7 11.3 2 94.4 11.3 10 96.5 10.6 3 27.3 11.2 11 83.0 10.5 4 179.2 11.1 12 23.5 10.3 5 71.9 11.1 13 58.7 10.7 6 97.9 11.2 14 93.8 11.0 7 93.5 11.0 15 34.4 10.8 8 70.0 10.7 Click here for the Excel Data File a. Determine the regression equation. (Round your answers to 4 decimal places.) b-1. State the decision rule for 0.05 significance level: H0: β ≤ 0; H1: β > 0. (Round your answer to 3 decimal places.) b-2. Compute the value of the test statistic. (Round your…The following table gives the prices of some food items in the base year and current year and the quantities sold in the base year and current year. Commodity 2000 2005 Price (K) Quantity Price (K) Quantity A B C 15 20 4 15 5 10 22 27 7 12 4 5 Compute the following price index numbers for 2005 from the above table: i. Laspeyre’s price index number ii. Paasche’s price index number
- Price information for selected foods for 2010 and 2018 is given in the table. Price Quantity Item 2010 2018 2010 2018 Cabbage (pound) $ 0.06 $ 0.05 2,000 1,500 Carrots (bunch) 0.10 0.12 200 200 Peas (quart) 0.20 0.18 400 500 Endive (bunch) 0.15 0.15 100 200 Compute a simple price index for each of the four items. Use 2010 as the base period. (Round your answers to 2 decimal places.)2. Given the data, test whether there is a relationship between the number of years in college (X) of thestudents and their subsequent yearly income at 5% level of significance.Q3The following information was recorded in a toy store: Year 2016 Year 2017 Year 2018 Price Quantity Price Quantity Price Quantity Slime 6 50 9 60 10 56 Sticky tact 2 100 2 105 2 120 Stinky egg 4 60 4 50 6 60 Teddy Bear 10 30 11 26 12 24 Tortoise 8 40 11 39 12 36 Q3The following information was recorded in a toy store: (a) By using the above data, compute the Laspeyres Price Index for year 2018 by using year 2016 as base year. (b) Interpret your answer in part (a)). (c) By using the above data, compute the Paasche Price Index for year 2018 by using year 2016 as base year. (d) Which item has experienced the greatest inflation rate from year 2017 to year 2018? (Just state your answer, no calculation is needed in part (d)).
- The prices and the numbers of various items produced by a small machine and stamping plant are reported below. Use 2010 as the base. 2010 2018 Item Price Quantity Price Quantity Washer $ 0.07 17,000 $ 0.10 20,000 Cotter pin 0.04 125,000 0.03 130,000 Stove bolt 0.15 40,000 0.15 42,000 Hex nut 0.08 62,000 0.10 65,000 a. Determine the simple price indexes. (Round your answers to 2 decimal places.) b. Determine the simple aggregate price index for the two years. (Round your answer to 2 decimal places.) c. Determine the Laspeyres price index. (Round your answer to 2 decimal places.) d. Determine the Paasche price index. (Round your answer to 2 decimal places.) e. Determine Fisher's ideal index. (Round your answer to 2 decimal places.)If a fictional treatment costs a total of $45,000 at today’s value and increases a person’s quality of life from 0.5 to 0.6 for the remainder of the person’s life from age 70 onward, and the person’s expected life span increases from 73 to 75, what is the total gain in QALYs (Quality-adjusted Life Years), and what is the ICER (Incremental Cost-effectiveness Ratio)?Given the following data and seasonal index: Month Sales Year 1 Year 2 Jan 8 8 Feb 7 9 Mar 5 6 Apr 10 11 May 9 12 June 12 16 July 15 20 Aug 20 25 Sept 4 4 Oct 3 2 Nov 8 7 Dec 9 9 (a) Compute the seasonal index using only year 1 data. (b) Determine the deseasonalized demand values using year 2 data and year 1's seasonal indices.