Quality of Life Experienced by Women and Men (N= 171) TABLE VI WOMEN (η74) MEAN (SD) MEN (n = 97) MEAN (SD) T VALUE (DF = 169) INSTRUMENTS AND COMPONENTS/SCALES P VALUE SF-36 (0 = low Qol, 100 = high QoL) The Physical Component Score (PCS) The Mental Component Score (MCS) 0.01 0.007 48.5 (5.7) 48.2 (7.6) 51.3 (23.7) 4.7 (14.1) 57.6 (26.2) 51.1 (17.6) 39.8 (19.0) 61.0 (27.4) 27.5 (39.5) 62.3 (22.9) 51.1 (7.4) 51.4 (7.5) -2.50 -2.74 0.049 0.007 58.6 (24.1) 12.6 (23.7) 62.5 (27.3) 54.2 (20.1) Physical Functioning (PF) -1.98 Role-Physical (RP) -2.54 Bodily Pain (BP) General Health (GH) 0.24 0.30 -2.31 Vitality (VT) Social Functioning (SF) Role-Emotional (RE) Mental Health (MH) 47.5 (23.2) 66.1 (23.2) 37.8 (42.7) 72.7 (20.1) 0.02 0.19 0.11 -3.15 0.002 OLI (0 = low Qol, 30- high QoL) Total Scale 20.1 (3.5) 21.2 (3.6) 19.3 (4.6) 22.9 (3.7) 21.1 (4.3) 26.0 (3.9) -2.06 0.04 0.049 Health Functioning Socioeconomic 17.9 (4.1) 22.6 (3.6) 19.6 (4.6) -1.99 0.58 Psychologic/spiritual -2.10 0.04 Family (N 69 women and 94 men) 25.6 (4.7) 0.51 "PCS = PF, RP, BP, GH. "MCS -VT, SF, RE, MH. 'df = 161. df = 168. Qol - Quality of life; QLI, Quality-of-Life Index-Cardiac Version. Kristofferzon, M., Löfmark, R., & Carlsson, M. (2005). Perceived coping, social support, and quality of life 1 month after myocardial infarction: A comparison between Swedish women and men. Heart & Lung, 341), p. 47. Study Questions 1. 1= -1.99 describes the difference between women and men post myocardial infarction (MI) for what variable? 2. Consider t= -2.74 and t= -2.31. Which calculated i ratio has the smaller p value? Provide a rationale for your answer. 3. Examine the results in Table VI. Which t ratio listed in the table had the largest p value? What was the focus of this 1-test, and were the results significant? Provide a rationale for your answer. 4. What is df? Why is it important to know the df for a t ratio? How would you calculate the df for a t-test, and what is the df for this study? 5. What is the cause of an increased risk for Type I errors when t-tests are conducted? How might researchers eliminate the increased risk for a Type I error in a study? 6. Given the information presented in Table VI, calculate a Bonferroni procedure for this study. 7. Does this study meet the assumptions for the t-test? Provide a rationale for your answer. 8. What sampling method did the researchers use in this study? Provide a rationale for your answer. 9. What level of data is analyzed by means and standard deviations? Is this level of data compatible with the assumptions for the t-test? Provide a rationale for your answer. 10. Is the sample size adequate to detect significant differences between the two groups in this study?
Quality of Life Experienced by Women and Men (N= 171) TABLE VI WOMEN (η74) MEAN (SD) MEN (n = 97) MEAN (SD) T VALUE (DF = 169) INSTRUMENTS AND COMPONENTS/SCALES P VALUE SF-36 (0 = low Qol, 100 = high QoL) The Physical Component Score (PCS) The Mental Component Score (MCS) 0.01 0.007 48.5 (5.7) 48.2 (7.6) 51.3 (23.7) 4.7 (14.1) 57.6 (26.2) 51.1 (17.6) 39.8 (19.0) 61.0 (27.4) 27.5 (39.5) 62.3 (22.9) 51.1 (7.4) 51.4 (7.5) -2.50 -2.74 0.049 0.007 58.6 (24.1) 12.6 (23.7) 62.5 (27.3) 54.2 (20.1) Physical Functioning (PF) -1.98 Role-Physical (RP) -2.54 Bodily Pain (BP) General Health (GH) 0.24 0.30 -2.31 Vitality (VT) Social Functioning (SF) Role-Emotional (RE) Mental Health (MH) 47.5 (23.2) 66.1 (23.2) 37.8 (42.7) 72.7 (20.1) 0.02 0.19 0.11 -3.15 0.002 OLI (0 = low Qol, 30- high QoL) Total Scale 20.1 (3.5) 21.2 (3.6) 19.3 (4.6) 22.9 (3.7) 21.1 (4.3) 26.0 (3.9) -2.06 0.04 0.049 Health Functioning Socioeconomic 17.9 (4.1) 22.6 (3.6) 19.6 (4.6) -1.99 0.58 Psychologic/spiritual -2.10 0.04 Family (N 69 women and 94 men) 25.6 (4.7) 0.51 "PCS = PF, RP, BP, GH. "MCS -VT, SF, RE, MH. 'df = 161. df = 168. Qol - Quality of life; QLI, Quality-of-Life Index-Cardiac Version. Kristofferzon, M., Löfmark, R., & Carlsson, M. (2005). Perceived coping, social support, and quality of life 1 month after myocardial infarction: A comparison between Swedish women and men. Heart & Lung, 341), p. 47. Study Questions 1. 1= -1.99 describes the difference between women and men post myocardial infarction (MI) for what variable? 2. Consider t= -2.74 and t= -2.31. Which calculated i ratio has the smaller p value? Provide a rationale for your answer. 3. Examine the results in Table VI. Which t ratio listed in the table had the largest p value? What was the focus of this 1-test, and were the results significant? Provide a rationale for your answer. 4. What is df? Why is it important to know the df for a t ratio? How would you calculate the df for a t-test, and what is the df for this study? 5. What is the cause of an increased risk for Type I errors when t-tests are conducted? How might researchers eliminate the increased risk for a Type I error in a study? 6. Given the information presented in Table VI, calculate a Bonferroni procedure for this study. 7. Does this study meet the assumptions for the t-test? Provide a rationale for your answer. 8. What sampling method did the researchers use in this study? Provide a rationale for your answer. 9. What level of data is analyzed by means and standard deviations? Is this level of data compatible with the assumptions for the t-test? Provide a rationale for your answer. 10. Is the sample size adequate to detect significant differences between the two groups in this study?

Glencoe Algebra 1, Student Edition, 9780079039897, 0079039898, 2018
18th Edition
ISBN:9780079039897
Author:Carter
Publisher:Carter
Chapter10: Statistics
Section10.3: Measures Of Spread
Problem 1GP

Related questions
Question
Can you answer #9?
Transcribed Image Text:MNU © 2020
Page 2 of 3
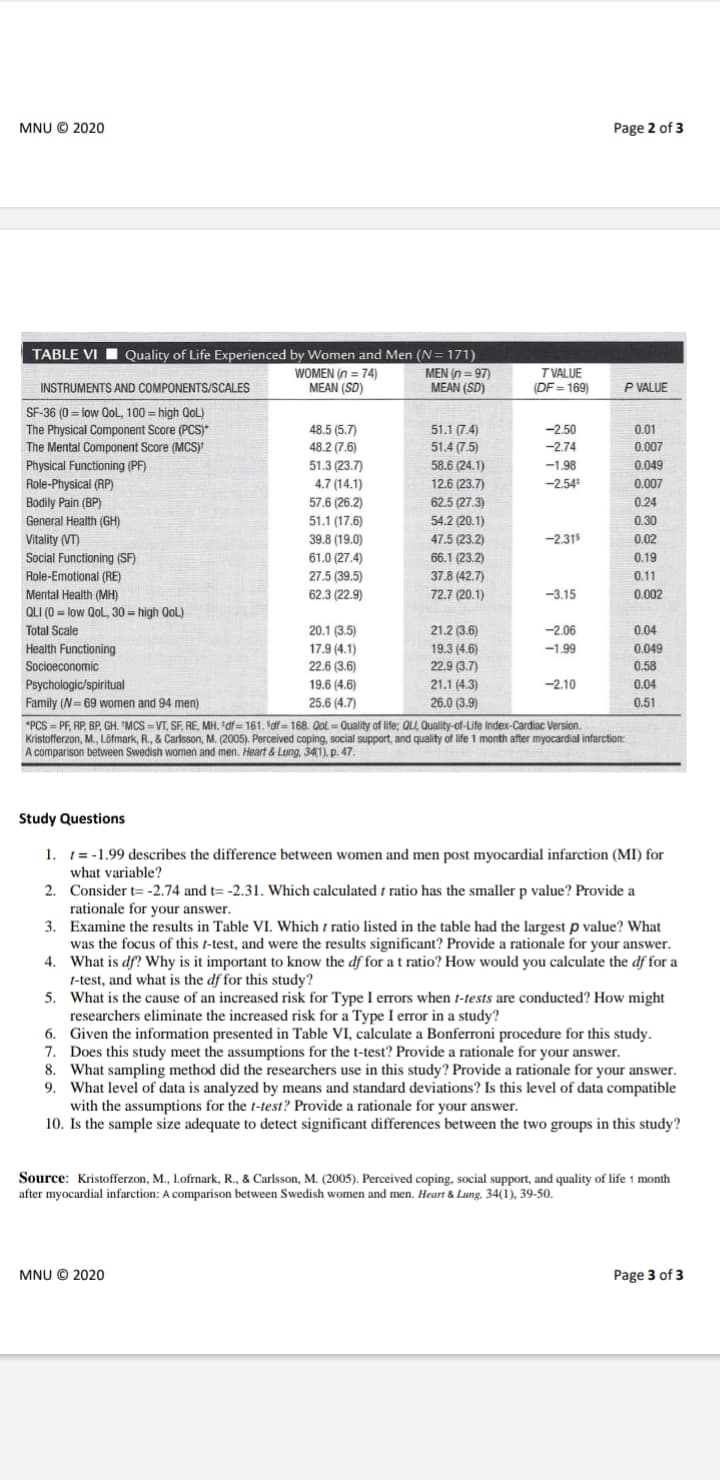
TABLE VI I Quality of Life Experienced by Women and Men (N= 171)
WOMEN (n = 74)
MEAN (SD)
MEN (n = 97)
MEAN (SD)
TVALUE
(DF = 169)
INSTRUMENTS AND COMPONENTS/SCALES
P VALUE
SF-36 (0 = low QoL, 100 = high QoL)
-2.50
48.5 (5.7)
48.2 (7.6)
51.3 (23.7)
51.1 (7.4)
51.4 (7.5)
58.6 (24.1)
12.6 (23.7)
0.01
The Physical Component Score (PCS)*
The Mental Component Score (MCS)
-2.74
0.007
Physical Functioning (PF)
-1.98
0.049
Role-Physical (RP)
Bodily Pain (BP)
General Health (GH)
4.7 (14.1)
-2.54
0.007
57.6 (26.2)
62.5 (27.3)
0.24
51.1 (17.6)
54.2 (20.1)
0.30
39.8 (19.0)
-2.31
Vitality (VT)
Social Functioning (SF)
47.5 (23.2)
0.02
61.0 (27.4)
66.1 (23.2)
0.19
Role-Emotional (RE)
27.5 (39.5)
37.8 (42.7)
0.11
Mental Health (MH)
62.3 (22.9)
72.7 (20.1)
-3.15
0.002
QLI (0 = low QoL, 30 = high QoL)
Total Scale
20.1 (3.5)
21.2 (3.6)
-2.06
0.04
Health Functioning
17.9 (4.1)
19.3 (4.6)
-1.99
0.049
Socioeconomic
22.6 (3.6)
22.9 (3.7)
0.58
19.6 (4.6)
21.1 (4.3)
26.0 (3.9)
Psychologic/spiritual
-2.10
0.04
Family (N= 69 women and 94 men)
25.6 (4.7)
0.51
*PCS = PF, RP, BP, GH. "MCS = VT, SF, RE, MH. "df = 161. Sdf= 168. Qol = Quality of life; QLI, Quality-of-Life Index-Cardiac Version.
Kristofferzon, M., Löfmark, R., & Carlsson, M. (2005). Perceived coping, social support, and quality of life 1 month after myocardial infarction:
A comparison between Swedish women and men. Heart & Lung, 341). p. 47.
Study Questions
1. t= -1.99 describes the difference between women and men post myocardial infarction (MI) for
what variable?
2. Consider t= -2.74 and t= -2.31. Which calculated t ratio has the smaller p value? Provide a
rationale for your answer.
3. Examine the results in Table VI. Which t ratio listed in the table had the largest p value? What
was the focus of this t-test, and were the results significant? Provide a rationale for your answer.
4. What is df? Why is it important to know the df for a t ratio? How would you calculate the df for a
t-test, and what is the df for this study?
5. What is the cause of an increased risk for Type I errors when t-tests are conducted? How might
researchers eliminate the increased risk for a Type I error in a study?
6. Given the information presented in Table VI, calculate a Bonferroni procedure for this study.
7. Does this study meet the assumptions for the t-test? Provide a rationale for your answer.
8. What sampling method did the researchers use in this study? Provide a rationale for your answer.
9. What level of data is analyzed by means and standard deviations? Is this level of data compatible
with the assumptions for the 1-test? Provide a rationale for your answer.
10. Is the sample size adequate to detect significant differences between the two groups in this study?
Source: Kristofferzon, M., Lofrnark, R., & Carlsson, M. (2005). Perceived coping, social support, and quality of life 1 month
after myocardial infarction: A comparison between Swedish women and men. Heart & Lung. 34(1), 39-50.
MNU © 2020
Page 3 of 3
Expert Solution
Step 1
The mean and standard deviations are used to analyse the continuous variables. A continuous variable can also have interval or ratio level of measurement.

Step by step
Solved in 2 steps

Knowledge Booster


Learn more about
Need a deep-dive on the concept behind this application? Look no further. Learn more about this topic, statistics and related others by exploring similar questions and additional content below.Recommended textbooks for you
Glencoe Algebra 1, Student Edition, 9780079039897…
Algebra
ISBN:
9780079039897
Author:
Carter
Publisher:
McGraw Hill

Holt Mcdougal Larson Pre-algebra: Student Edition…
Algebra
ISBN:
9780547587776
Author:
HOLT MCDOUGAL
Publisher:
HOLT MCDOUGAL
Glencoe Algebra 1, Student Edition, 9780079039897…
Algebra
ISBN:
9780079039897
Author:
Carter
Publisher:
McGraw Hill
Holt Mcdougal Larson Pre-algebra: Student Edition…
Algebra
ISBN:
9780547587776
Author:
HOLT MCDOUGAL
Publisher:
HOLT MCDOUGAL