The pie chart shows the distribution of the opinions of parents on whether a college education is worth the expense. An economist claims that the distribution of the opinions of teenagers is different from the distribution for parents. To test this claim, you randomly select 200 teenagers and ask each whether a college education is worth the expense. The table to the right shows the results. At a= 0.10, test the economist's claim. Survey results Response Frequency, f 87 64 Strongly agree Somewhat agree Neither agree nor disagree Somewhat disagree Strongly disagree W Click the icon for the pie chart of the distribution. 35 12 2 State Ho and H, and identify the claim. Ho: The distribution of the opinions of whether a college education is worth the expense is the same for teenagers and parents. H: The distribution of the opinions of whether a college education is worth the expense is different for teenagers and parents. Which hypothesis is the claim? O Ho V H. Calculate the test statistic. is different for teenagers and parents. X = 70.528 (Round to three decimal places as needed.) is the same for teenagers and parents. Determine the P-value. is uniform for teenagers. P= 0 (Round to three decimal places as needed.) Decide whether reject or fail to reject the null hypothesis. Then interpret the decision in the context of the original claim. is uniform for parents. V Ho. At the 10% significance level, there V enough evidence to conclude that the distribution of the opinions of whether a college education is worth the expense
The pie chart shows the distribution of the opinions of parents on whether a college education is worth the expense. An economist claims that the distribution of the opinions of teenagers is different from the distribution for parents. To test this claim, you randomly select 200 teenagers and ask each whether a college education is worth the expense. The table to the right shows the results. At a= 0.10, test the economist's claim. Survey results Response Frequency, f 87 64 Strongly agree Somewhat agree Neither agree nor disagree Somewhat disagree Strongly disagree W Click the icon for the pie chart of the distribution. 35 12 2 State Ho and H, and identify the claim. Ho: The distribution of the opinions of whether a college education is worth the expense is the same for teenagers and parents. H: The distribution of the opinions of whether a college education is worth the expense is different for teenagers and parents. Which hypothesis is the claim? O Ho V H. Calculate the test statistic. is different for teenagers and parents. X = 70.528 (Round to three decimal places as needed.) is the same for teenagers and parents. Determine the P-value. is uniform for teenagers. P= 0 (Round to three decimal places as needed.) Decide whether reject or fail to reject the null hypothesis. Then interpret the decision in the context of the original claim. is uniform for parents. V Ho. At the 10% significance level, there V enough evidence to conclude that the distribution of the opinions of whether a college education is worth the expense

Glencoe Algebra 1, Student Edition, 9780079039897, 0079039898, 2018
18th Edition
ISBN:9780079039897
Author:Carter
Publisher:Carter
Chapter10: Statistics
Section10.5: Comparing Sets Of Data
Problem 26PFA

Related questions
Question
100%
Decide whether to reject or fail to reject the null hypothesis. Then interpret the decision in the context of the original claim
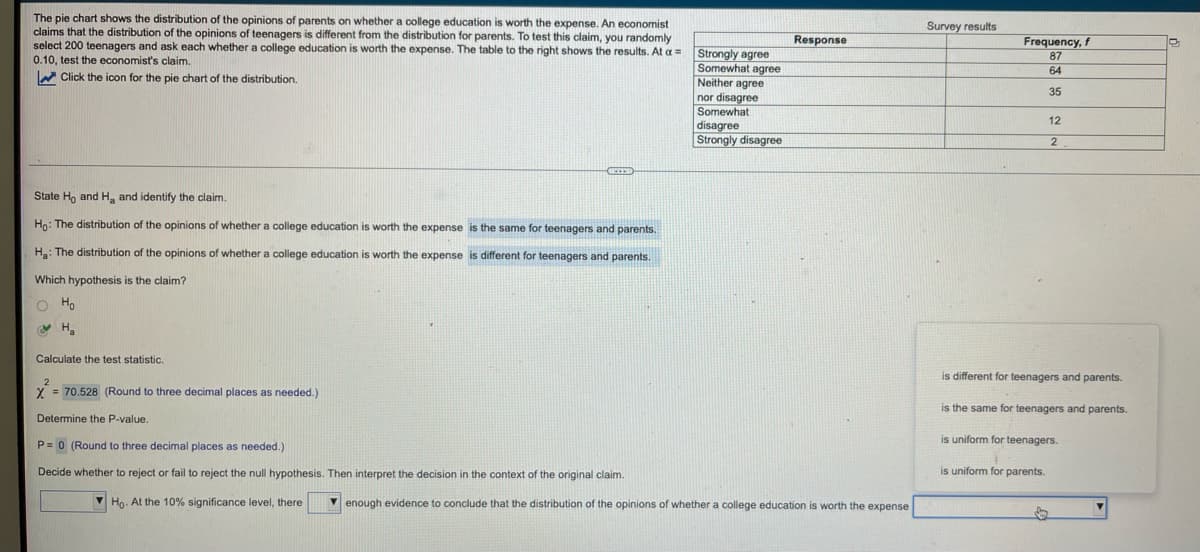
Transcribed Image Text:The pie chart shows the distribution of the opinions of parents on whether a college education is worth the expense. An economist
claims that the distribution of the opinions of teenagers is different from the distribution for parents. To test this claim, you randomly
select 200 teenagers and ask each whether a college education is worth the expense. The table to the right shows the results. At a =
0.10, test the economist's claim.
Survey results
Response
Frequency, f
Strongly agree
Somewhat agree
Neither agree
87
64
W Click the icon for the pie chart of the distribution.
35
nor disagree
Somewhat
disagree
Strongly disagree
12
2.
State Ho and H, and identify the claim.
Hn: The distribution of the opinions of whether a college education is worth the expense is the same for teenagers and parents.
H: The distribution of the opinions of whether a college education is worth the expense is different for teenagers and parents.
Which hypothesis is the claim?
O Ho
V H.
Calculate the test statistic.
is different for teenagers and parents.
Y = 70,528 (Round to three decimal places as needed.)
is the same for teenagers and parents.
Determine the P-value.
is uniform for teenagers.
P= 0 (Round to three decimal places as needed.)
Decide whether to reject or fail to reject the null hypothesis. Then interpret the decision in the context of the original claim.
is uniform for parents.
V Họ. At the 10% significance level, there
v enough evidence to conclude that the distribution of the opinions of whether a college education is worth the expense
Expert Solution
This question has been solved!
Explore an expertly crafted, step-by-step solution for a thorough understanding of key concepts.

This is a popular solution!

Trending now
This is a popular solution!

Step by step
Solved in 2 steps

Recommended textbooks for you
Glencoe Algebra 1, Student Edition, 9780079039897…
Algebra
ISBN:
9780079039897
Author:
Carter
Publisher:
McGraw Hill

Big Ideas Math A Bridge To Success Algebra 1: Stu…
Algebra
ISBN:
9781680331141
Author:
HOUGHTON MIFFLIN HARCOURT
Publisher:
Houghton Mifflin Harcourt

Glencoe Algebra 1, Student Edition, 9780079039897…
Algebra
ISBN:
9780079039897
Author:
Carter
Publisher:
McGraw Hill
Big Ideas Math A Bridge To Success Algebra 1: Stu…
Algebra
ISBN:
9781680331141
Author:
HOUGHTON MIFFLIN HARCOURT
Publisher:
Houghton Mifflin Harcourt