sample of 9 women has the following weight (in Ibs): 110, 108, 114, 95, 102, 98, significance, can you agree to the claim? P-value: Decision: Conclusion:
sample of 9 women has the following weight (in Ibs): 110, 108, 114, 95, 102, 98, significance, can you agree to the claim? P-value: Decision: Conclusion:

Holt Mcdougal Larson Pre-algebra: Student Edition 2012
1st Edition
ISBN:9780547587776
Author:HOLT MCDOUGAL
Publisher:HOLT MCDOUGAL
Chapter11: Data Analysis And Probability
Section11.4: Collecting Data
Problem 5E

Related questions
Question
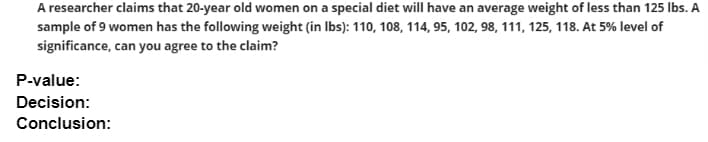
Transcribed Image Text:A researcher claims that 20-year old women on a special diet will have an average weight of less than 125 lbs. A
sample of 9 women has the following weight (in Ibs): 110, 108, 114, 95, 102, 98, 111, 125, 118. At 5% level of
significance, can you agree to the claim?
P-value:
Decision:
Conclusion:
Expert Solution
This question has been solved!
Explore an expertly crafted, step-by-step solution for a thorough understanding of key concepts.

Step by step
Solved in 2 steps with 1 images

Recommended textbooks for you
Holt Mcdougal Larson Pre-algebra: Student Edition…
Algebra
ISBN:
9780547587776
Author:
HOLT MCDOUGAL
Publisher:
HOLT MCDOUGAL

Glencoe Algebra 1, Student Edition, 9780079039897…
Algebra
ISBN:
9780079039897
Author:
Carter
Publisher:
McGraw Hill
Holt Mcdougal Larson Pre-algebra: Student Edition…
Algebra
ISBN:
9780547587776
Author:
HOLT MCDOUGAL
Publisher:
HOLT MCDOUGAL
Glencoe Algebra 1, Student Edition, 9780079039897…
Algebra
ISBN:
9780079039897
Author:
Carter
Publisher:
McGraw Hill