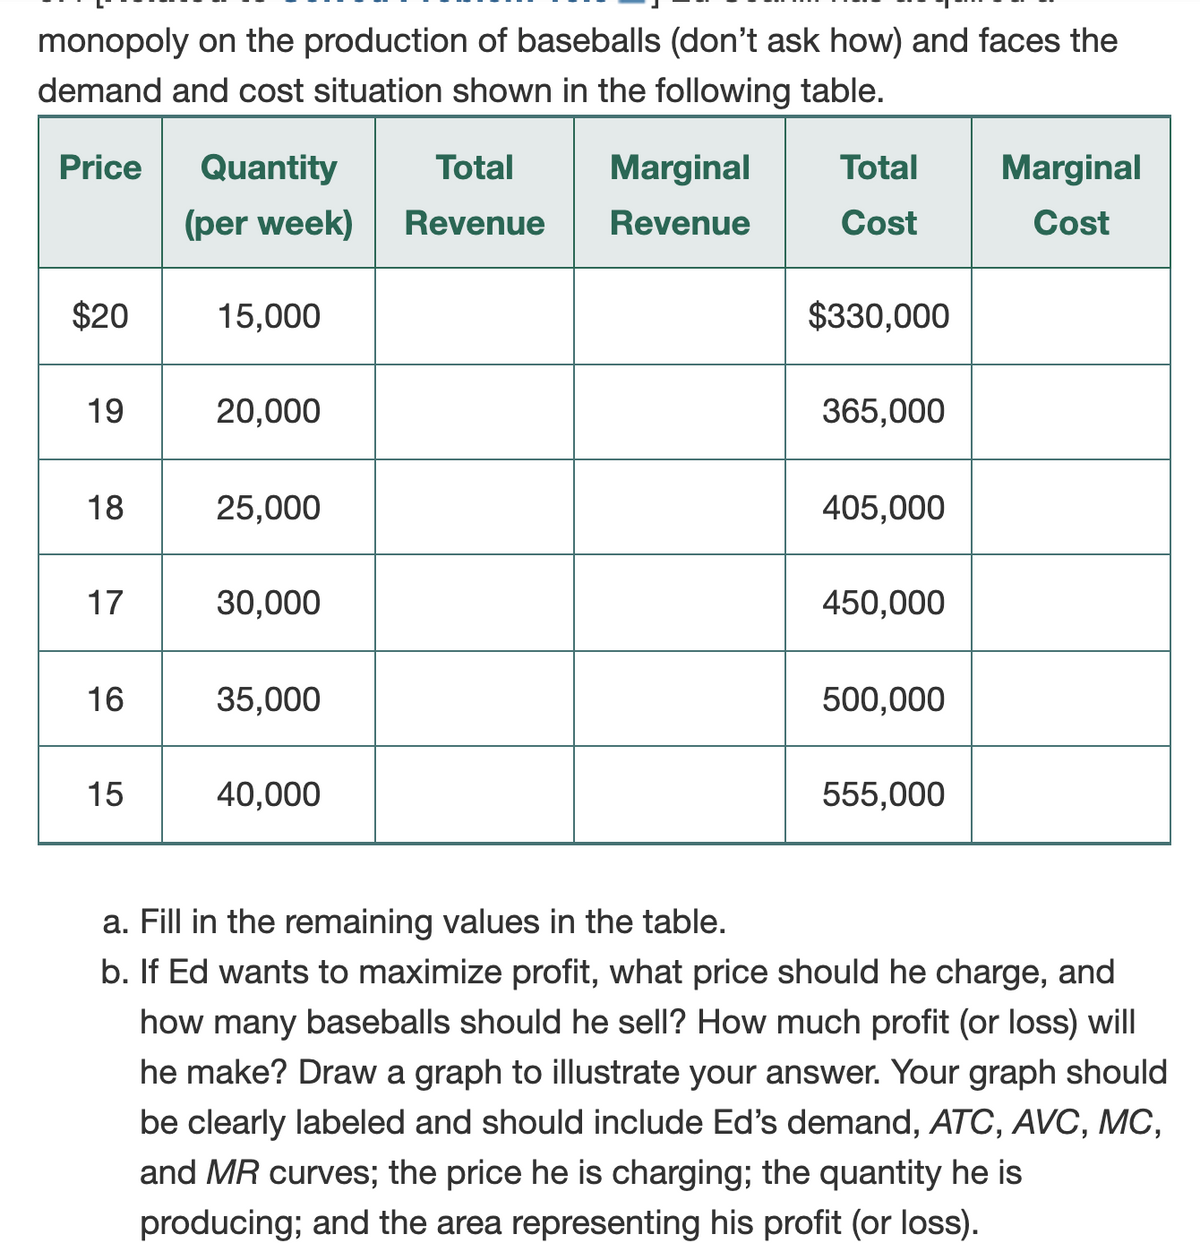
monopoly on the production of baseballs (don't ask how) and faces the demand and cost situation shown in the following table. Price Quantity Total Marginal Total Marginal (per week) Revenue Revenue Cost Cost $20 15,000 $330,000 19 20,000 365,000 18 25,000 405,000 17 30,000 450,000 16 35,000 500,000 15 40,000 555,000 a. Fill in the remaining values in the table. b. If Ed wants to maximize profit, what price should he charge, and how many baseballs should he sell? How much profit (or loss) will he make? Draw a graph to illustrate your answer. Your graph should be clearly labeled and should include Ed's demand, ATC, AVC, MC, and MR curves; the price he is charging; the quantity he is producing; and the area representing his profit (or loss).
monopoly on the production of baseballs (don't ask how) and faces the demand and cost situation shown in the following table. Price Quantity Total Marginal Total Marginal (per week) Revenue Revenue Cost Cost $20 15,000 $330,000 19 20,000 365,000 18 25,000 405,000 17 30,000 450,000 16 35,000 500,000 15 40,000 555,000 a. Fill in the remaining values in the table. b. If Ed wants to maximize profit, what price should he charge, and how many baseballs should he sell? How much profit (or loss) will he make? Draw a graph to illustrate your answer. Your graph should be clearly labeled and should include Ed's demand, ATC, AVC, MC, and MR curves; the price he is charging; the quantity he is producing; and the area representing his profit (or loss).

Chapter9: Monopoly
Section: Chapter Questions
Problem 6SQP

Related questions
Question
Can you answer b for me please
Transcribed Image Text:monopoly on the production of baseballs (don't ask how) and faces the
demand and cost situation shown in the following table.
Price
Quantity
Total
Marginal
Total
Marginal
(per week)
Revenue
Revenue
Cost
Cost
$20
15,000
$330,000
19
20,000
365,000
18
25,000
405,000
17
30,000
450,000
16
35,000
500,000
15
40,000
555,000
a. Fill in the remaining values in the table.
b. If Ed wants to maximize profit, what price should he charge, and
how many baseballs should he sell? How much profit (or loss) will
he make? Draw a graph to illustrate your answer. Your graph should
be clearly labeled and should include Ed's demand, ATC, AVC, MC,
and MR curves; the price he is charging; the quantity he is
producing; and the area representing his profit (or loss).
Expert Solution
This question has been solved!
Explore an expertly crafted, step-by-step solution for a thorough understanding of key concepts.

This is a popular solution!

Trending now
This is a popular solution!

Step by step
Solved in 2 steps with 2 images

Knowledge Booster


Learn more about
Need a deep-dive on the concept behind this application? Look no further. Learn more about this topic, economics and related others by exploring similar questions and additional content below.Recommended textbooks for you


Principles of Economics 2e
Economics
ISBN:
9781947172364
Author:
Steven A. Greenlaw; David Shapiro
Publisher:
OpenStax
Principles of Economics 2e
Economics
ISBN:
9781947172364
Author:
Steven A. Greenlaw; David Shapiro
Publisher:
OpenStax

Exploring Economics
Economics
ISBN:
9781544336329
Author:
Robert L. Sexton
Publisher:
SAGE Publications, Inc

Essentials of Economics (MindTap Course List)
Economics
ISBN:
9781337091992
Author:
N. Gregory Mankiw
Publisher:
Cengage Learning
