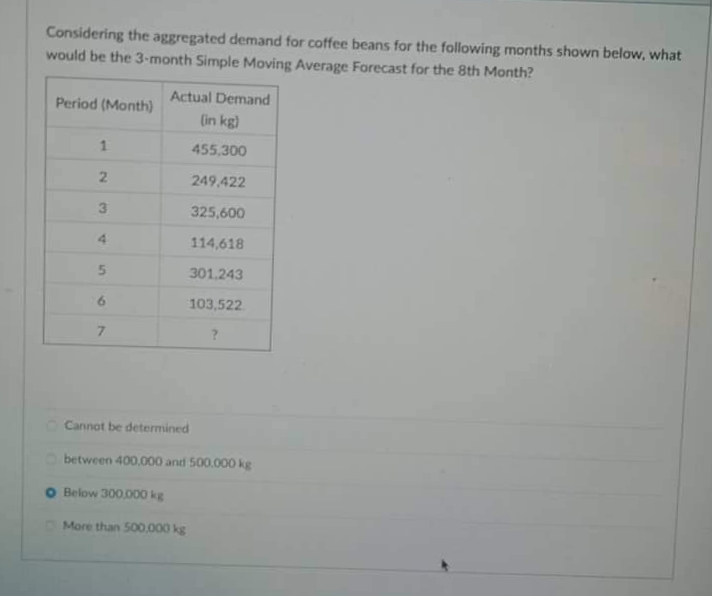
months show the 3-month Simple Moving Average Forecast for the 8th Month? Actual Demand Month) (in kg) 455.300 249.422 325,600 114,618 301.243 103,522 ? be determined m 400,000 and 500.000 kg 00.000 kg an 500.000 kg


Q: Given the following information determine the linear regression model Sxx = 1106.56 Sxy=-41,112.65…
A: It is given that SXX=1106.56, SXY=-41,112.65 and B0 is 2627.82.
Q: Let p be the proportion of a population that is employed. Data was collected from a survey, and for…
A: Solution: Given information: p^= 0.5 Sample proportion p= 0.6 Population proportion The big…
Q: (c) What is the probability of obtaining x = 152 or fewer individuals with the characteristic? That…
A: Given Data population proportion,p = 0.8 sample size n = 200
Q: (a) Consider a t distribution with 30 degrees of freedom. Compute P(-1.46 <t<1.46). Round your…
A: a) Given data : degree of freedom=df=30
Q: An epidemiologist needs to estimate the proportion of residents of Indian River county that have…
A: GivenMargin of error(E)=0.057Confidence interval = 90%
Q: The plant manager believes that the operators take a lunch break for more than 60 minutes. A sample…
A: Given,sample size(n)=15sample mean(x¯)=60standard deviation(s)=5α=0.05
Q: Create a scatter plot of the data given and write an exponential equation for the function…
A: Find: Fit exponential regression equation to the given data represented by the graph.
Q: A study was conducted that investigated the gene ACTN3, which encodes a protein that functions in…
A: Solution: We are interested in testing the hypothesis that whether there is an association between…
Q: B. Direction: Consider the number of hours per week spent by 50 students playing computer games.…
A: Solution: Interval f x fx (x-x) x-x fx-x (x-x)2 f(x-x)2 44 - 40 2 42 84 15.6 15.6 31.2 243.36…
Q: 13.Find a 95% CI on the mean volume of syrup dispensed? a) 19.79, 29.21 b) 12.12, 16.23 c) 62.10,…
A: Note: Questions 13,14 and 15 are three different questions. As per the guidelines, I have to answer…
Q: Using the given distribution below, answer item numbers 8 - 10. Frequency Ages 15-17 2 12-14 6 9-11…
A: Mean(x¯)=∑f.x∑fMean(x¯)=15012Mean(x¯)=12.5 Class f Mid value (x) f⋅x x-x¯=|x-12.5| f⋅|x-x¯| 15…
Q: An advertising agency collected a random sample of 300 businesses targeted with an advertising…
A: Given problem is hypothesis testing of population proportion n= Random sample=300 x=No. of items of…
Q: Determine the test statistic for the hypothesis test. Round the solution to two decimal places.…
A: Using a significance level of 2%, we need to test the hypothesis that the proportion of all people…
Q: Solve the given equation for x. (Remember that e *#0 for all values of x.) Xe + e- x = 0 (Use a…
A: Given that, x exp(-x) + exp(-x) =0 We have to find the value of x.
Q: PROBLEM SET 8.2 1-6 ELASTIC DEFORMATIONS Given A in a deformation y= Ax, find the principal…
A: Note: As per guidelines we will solve the first question only, please repost other questions for…
Q: A hunger-relief organization is trying to determine the lowest likely proportion of the local…
A:
Q: A production engineer collected a sample of 14 parts to measure their weights. The sample mean was…
A: Given that, n= 14, mean =8.48kg, sigma=0.79kg We have to find 95% lower confidence bound.
Q: The marketing team at an internet music site wants a better understanding of who their customers…
A: Given: x ordered value 13 13 15 15 19 19 22 20 24 22 20 24 28 28…
Q: Jane wants to estimate the proportion of students on her campus who eat cauliflower. After surveying…
A: The answer is attached below,
Q: A training programme is organised to upgrade supervisory skills. Study of participants indicate that…
A: Given problem is normal distribution. Let X: Time spent on training programme Mean=μ=500 S.D.=σ=100…
Q: A student researcher was surprised to learn that the 2017 NCAA Student-Athlete Substance Use Survey…
A: Since the question to be answered is not specified, we'll be answering only the first question.…
Q: Test B. Directions: Complete the table below by supplying the missing entries Item No. Description…
A: Hi there! Since there are multiple subparts we will solve first three subparts for you. To get…
Q: A production engineer collected a sample of 14 parts to measure their weights. The sample mean was…
A: Given : Sample Size, n = 14 Sample Mean, x̄ = 8.48
Q: A probability function for a discrete random variable, Y, is shown below. y P(Y=y) 4 0.4…
A:
Q: A company collects data on the lengths of telephone calls made by employees in two different…
A: For the sales division, the sample mean is 10.26 and the sample standard deviation is 8.56. For the…
Q: robability. An airline knows from experience that the distribution of the number of suitcases that…
A:
Q: Test A. Directions: Analyze the given problem below. As per Beat Covid-19 Today, a Covid-19…
A: Given no. of active cases (region wise) is:
Q: conducting a study to see if the probability negative a test for a certain cancer is significantly…
A: Given : You are conducting a study to see if the probability of a true negative on a test for a…
Q: 4.6 4.6 4.4 4.5 4.3 4.7 4.9 4.6 4.6 4.6 4.5 4.7 4.5 4.5 4.6 4.6 4.6 4.8 1. Use the ungrouped data…
A:
Q: 1. A shift is considered “light” if at most two patients arrive during it. What is the probability…
A: here given , Patients at a hospital appear to arrive independently from each other, at a constant…
Q: According to a study, the proportion of people who are satisfied with the way things are going their…
A: From the provided information, Population proportion (p) = 0.78 Sample size (n) = 100
Q: Let X and Y be two independent random variables distributed uniformly on the interval [0, 1]. What…
A:
Q: The linear model y=Bo +B₁X+E is in use and the values of x,y, and e, are shown below. Determine the…
A: Given The linear model y=β0+β1x+ε is in use and values of x,y and ei are given below Obs. no. x…
Q: Estimate the minimum sample size needed to achieve the margin of error E=0.032 for a 95% confidence…
A:
Q: Do all parts please.
A: As there are more than 3 questions as per the company guidelines we are supposed to do the first…
Q: If X Z N(5,4), then what is the probability that 8 < Y < 13 where Y = 2r +1?
A: Solution: Let X~N(μ= 5, σ2= 4)
Q: Can smoking negatively affect one's ability to become pregnant? A study collected data on 654 women…
A: Obtain the proportion of women that were not pregnant were also smokers. The proportion of women…
Q: 5. Ho: p = 0.15, p= 0.13, Zcritical = Decision: n=80, Ha: p = 0.15 confidence level = 95% Zcomputed
A: As per our guidelines we are suppose to answer only one question…
Q: Studies indicate that excessive noise at night can affect weight gain. One study of n = 127 rats…
A:
Q: A firm uses simple exponential smoothing with trend adjustment to forecast demand, "a = 0.7" and…
A: Given that smoothing constants α=0.7 and β=0.6 FITt-1=413At-1=457Tt-1=21
Q: Question 18: Let YY represent the profit (or loss) for a certain company XX years after 1960. Based…
A: Given :
Q: a. For this study, we should use Select an answer b. The null and alternative hypotheses would be:…
A: The hypothesized proportion is 0.54.
Q: L 3. Calculating a 5-Year Moving Average Example Example Problem: Calculate a five-year moving…
A:
Q: The National Institute of Mental Health published an article stating that in any one-year period,…
A: According to the given information in this question We need to apply z test for one population…
Q: A researcher wishes to estimate the percentage of adults who support abolishing the penny. sample…
A: a) Given : Margin of error: ME = 0.05 sample proportion: p̂ = 0.28…
Q: The price of the ordinary N25 shares of Manco plc quoted on the Stock Exchange at the close of…
A: Given data indicates the rice of the ordinary N25 shares of Manco plc quoted on the Stock Exchange…
Q: A simple random sample of 36 Chowchow dog weights yields a sample mean of 193 pounds. It is known…
A:
Q: 5. If the variance of a data set is 64, what is the standard deviation? a. 4 b. 8 c. 32 d. 4096 6.…
A: To find: 1.Standard deviation 2.Variance
Q: The scatterplot below shows opening weekend gross sales (measured in millions of $US) and total…
A: The scatterplot is plotted between weekend gross sales (in millions of $US) and total world gross…
Q: The work week for adults in the US that work full time is normally distributed with a mean of 47…
A:

Step by step
Solved in 2 steps with 2 images

- Use the table of values you made in part 4 of the example to find the limiting value of the average rate of change in velocity.Given the following data for demand at the XYZ Company, calculate the monthly forecast for 2003 using a 3-month moving average. Calculate the Forecast, Error, MAD (mean absolute percentage error), Bias and the TS (tracking signal) .Below is a table containing data on product demand for the most recent five months along with the forecasts that had been made for those 5 previous months. Use the exponential smoothing method to forecast the number of sales to expect next month. Use the following value of alpha: 0.2. Month Demand Forecast 1 308 349.2 2 388 340.9 3 344 350.3 4 400 349.1 5 341 359.3
- The table shows the sales revenue from the past 8 quarters. What is the 4-period moving average forecast of the next quarter? Year 1 Year 2 Year 3 Q1 Q2 Q3 Q4 Q1 Q2 Q3 Q4 Q1 11 10 9 12 10 7 7 11 ?Metropolitan Hospital has estimated its average monthly bed needs, N, as: N=460+9X�=460+9� where X = time period (months); (January 2002 = 0) Assume that no new hospital additions are expected in the area in the foreseeable future. The following monthly seasonal adjustment factors have been estimated, using data from the past five years: Forecast Metropolitan's bed demand for January, April, July, November, and December 2007. Month Adjustment Factor (%) Forecast January +5 April -15 July +4 November -5 December -25 Suppose the following actual and forecast values for June bed demands have been recorded. Year Forecast Actual 2007 1,045 1,139 2006 937 974 2005 829 895 2004 721 743 2003 613 656 2002 505 515 What seasonal adjustment factor would you recommend be used in making future June forecasts? 2.1% 5.5% 1.3%The accompanying dataset provides data on monthly unemployment rates for a certain region over four years. Compare 3- and 12-month moving average forecasts using the MAD criterion. Which of the two models yields better results? Explain. Find the MAD for the 3-month moving average forecast. MAD=? (Type an integer or decimal rounded to three decimal places as needed.) Year Month Rate(%) 2010 Jan 7.8 2010 Feb 8.2 2010 Mar 8.8 2010 Apr 9.1 2010 May 9.5 2010 Jun 9.3 2010 Jul 9.7 2010 Aug 9.6 2010 Sep 9.8 2010 Oct 10.1 2010 Nov 9.7 2010 Dec 9.8 2011 Jan 9.7 2011 Feb 9.9 2011 Mar 9.8 2011 Apr 9.9 2011 May 9.7 2011 Jun 9.4 2011 Jul 9.4 2011 Aug 9.3 2011 Sep 9.7 2011 Oct 9.3 2011 Nov 9.9 2011 Dec 9.5 2012 Jan 9.3 2012 Feb 8.8 2012 Mar 8.7 2012 Apr 9.1 2012 May 9.2 2012 Jun 9.2 2012 Jul 9.1 2012 Aug 9.1 2012 Sep 9.1 2012 Oct 8.9 2012 Nov 8.4 2012 Dec 8.3 2013 Jan 8.4 2013 Feb 8.1 2013 Mar 8.4 2013 Apr…
- The problem is based on the following data given. Observations of the demand for a certain part stocked at a parts supply depot during the calendar year 2013 were ( as shown ). Using a four-month moving average, determine the two-step-ahead forecast for July through December 2013. (Hint: The two-step-ahead forecast for July is based on the observed demands in February through May.)The forecast for year 6 using a weighted 2-year moving average with weights of 0.350.35 and 0.650.65 (the weight of 0.650.65 is for the most recent period) is what?The demand and forecast information for the XYZ Company over a twelve-month period has been collected in the Microsoft Excel Online file below. Use the Microsoft Excel Online file below to develop forecast accuracy and answer the following questions. Forecast Accuracy Measures Period Actual Demand Forecast Error Absolute Error Error^2 Abs. % Error 1 1,300 1,378 2 2,000 1,676 3 1,800 1,974 4 1,700 2,272 5 2,300 2,570 6 3,800 2,868 7 3,200 3,166 8 3,100 3,464 9 3,900 3,761 10 4,600 4,059 11 4,200 4,357 12 4,300 4,655 Total Average RSFE MAD MSE MAPE Tracking Signal 1. What can be concluded about the quality of the forecasts? Assume that the control limit for the tracking signal is ±3. The results indicate (bias or no bias) in the…
- John Kittle, an independent insurance agent, uses a five-year moving average to forecast the number of claims made in a single year for one of the large insurance companies he sells for. He has just discovered that a clerk in his employ incorrectly entered the number of claims made four years ago as 1,400 when it should have been 1,200.a. What adjustment should Mr. Kittle make in next year’s forecast to take into account the corrected value of the number of claims four years ago?b. Suppose that Mr. Kittle used simple exponential smoothing with a = .2instead of moving averages to determine his forecast. What adjustment is now required in next year’s forecast? (Note that you do not need to know the value of the forecast for next year in order to solve this problem.)Given the following average demand for each month, calculate the seasonal indicesfor each month.The following table gives the number of pints of type A blood used at Damascus Hospital in the past 6 weeks: Week Of Pints UsedAugust 31 360September 7 389September 14 410September 21 378September 28 368October 5 374 a) The forecasted demand for the week of October 12 using a 3-week moving average = 373.33 pints (round your response to two decimal places). b) Using a 3-week weighted moving average, with weights of 0.15, 0.25, and 0.60, using 0.60 for the most recent week, the forecasted demand for the week of October 12 = ? pints (round your response to two decimal places and remember to use the weights in appropriate order — the largest weight applies to most recent period and smallest weight applies to oldest period.)