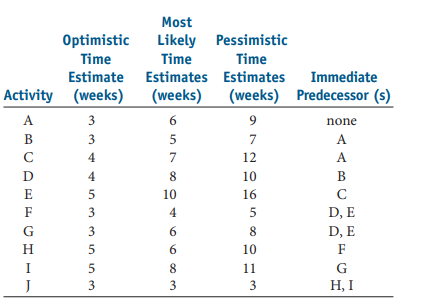
Most Optimistic Time Likely Pessimistic Time Time Estimate Estimates Estimates Immediate Activity (weeks) (weeks) (weeks) Predecessor (s) A 6. 9 none B 5 7 A C 4 7 12 A D 4 8 10 B E 10 16 C F 3 4 5 D, E G 3 6. 8 D, E H 10 F I 8. 11 G 3 Н, I 3. 33


Q: Dr. P. Question 4 An activity in a network diagram has an optimistic time estimate of five days, a…
A: The answer is as below:
Q: a. Prepare a work breakdown structure showing tasks, durations, and predecessor tasks. b. Construct…
A: A - 2 B A 2 C A 1 D A 5 E B, C 2 F D, E 5 G F 1 Solution: a) Activity Description…
Q: Question 4. The following table shows the tasks, dependencies, and estimated times a project manager…
A: The Activity on Node diagram is as follows:
Q: Q 2/Draw the PERT network from the given Finformation in the table below: Activity 1 M 12 a 18 1 3…
A: Given Information:
Q: How many productive resources (Person) are needed on throughout each task of the project?
A: A project schedule network diagram shows the sequence of the task that is performed to complete a…
Q: Question 2. Table 2: Time Scale for Project X and Table 3: Project X's report after 10 days of…
A: An AON network diagram is shown below: Now to calculate total duration we will consider the…
Q: Using the information given and the project completiontime calculated in Problem 9(a), reduce the…
A: as information provided further to solve a part of question
Q: If the jobs displayed in Table 18.23 are processed using the earliest-due-date rule, whatwould be…
A: The earliest due date (EDD) rule gives the occupation with the earliest due date dependent on…
Q: Task Task Description Predecessors Time estimate (in minutes) te σ2 to tm tp A Slice the…
A: Drawing a network diagram can help in identifying the critical path and the critical activities…
Q: You and several friends are about to prepare a lasagna dinner. The tasks to be performed, their…
A: Note: - Since we can answer only up to three subparts we will answer the first three subparts(1, 2,…
Q: Draw the Gantt Chart with Nodes (Early Start, Early Finish, Late Start, Late Finish, Slack and…
A: A network diagram related to the project shows the sequence of the task that is performed to…
Q: Practice Question EVM: A simple project consists of five tasks and is scheduled to take 13 weeks to…
A: ACWP = The actual cost of work performed is the cost actually incurred & recorded in completing…
Q: Q5. Find slack time using cpm approach? Activities Time days Immediate predecessor a A 3 6. B 2 4 4…
A: Given that: Activities a m b A 3 6 8 B 2 4 4 C 1 2 3 D 6 7 8 E 2 4 6 F 6 10 14 G 3…
Q: Consider the following work breakdown structure: Time Estimates (days) Optimistic Most Likely…
A: Critical path analysis (CPA) is a project managerial technique that represents identifying each…
Q: Act Immediate Predecessor Duration Activity Description Relationship Lag (weeks) ID (weeks) Planning…
A: The precedence relationship diagram is as follows: The possible paths are: 1) P1 - P3 - D3 - D4…
Q: ACTIVITY IMMEDIATE PREDECESSOR OPTIMISTIC TIME MOST LIKELY TIME PESSIMISTIC TIME A __________…
A: Please refer to the representation of the problem in excel : 1.What is the probability that the…
Q: Time (days) Immediate Activity a m b Predecessor(s) A 6. 9 B 4 5 1 2 D 7 В, D А, Е А, Е E 2 4 F 10…
A:
Q: Using the information given,(a) Calculate the expected time for each of the projectactivities. (b)…
A: Given data is
Q: Question 1. If the goal is to produce 180 units per hour. The tasks, task times, and immediate…
A: Since there are multiple questions, as per policy we will proceed to answer the first three…
Q: Question 13 Jassim is a 'Team Leader with a three month project to develop a new mobile phone app.…
A: In an organization, the structure, culture, framework, and design play key roles in determining the…
Q: 1- 7- 8- Jobs (i-j)2 1-3 2-3 2-4 3-5 4-6 4-8 5-6 6-7 8. Duration s (in days) 10 18 5 10 12 18 10 8 4…
A: Jobs (i-j) Duration 1-2 10 1-3 18 2-3 5 2-4 10 3-5 12 4-6 18 4-8 10 5-6 8 5-7 4…
Q: The project manager conducted a time study of the steel bending team with the times given below. The…
A: Given, The performance rating = 115% Allowance factor = 10% The standard time for the operation…
Q: 9. A work operation consisting of three (3) elements has been subjected to a time study. The…
A: Note: - Since the exact question that has to be answered is not specified we will answer the first…
Q: D Question 1 What is the earliest finish time for activity B? O 8 days O 32 days O 20 days O 12 days…
A: ES Task EF LS Time LF ES = Early Start EF = Early Finish LS = Late Start LF = Late Finish…
Q: QUESTION FOUR . 4a Poorly defined Scope of work (SOW) is a recipe for disaster and…
A: Risk is any surprising occasion that can influence your project — for better or in negative ways.…
Q: Construct a network diagram using AON notation
A: GIVEN
Q: 1. The standard time for a bank teller to process a loan form is estimated in seconds by 4 values:…
A: Estimated time in seconds 120 sec,140 sec,70sec, and 135 sec
Q: QUESTION 9 4 Aini is a network device commonly used to display project schedules. It was developed…
A: A complete handwritten solution is provided as asked by the student. Here, please refer to step 4…
Q: Activities Duration (days) Preceding activities A 5 3 7 E B F A.C 6 A.C,E 5 A,C,E 2 D. K 7 D. L…
A:
Q: You are the manager of a project to improve a billing processat your firm. Table 7.7 contains the…
A: Critical Path In project management, the longest distance between the start and the end, including…
Q: Activity / Preceding activity A/- BI- C/- D/A E/A F/A G/A,B,E H/A,D,C I/A,F Estimated time (days)…
A: Find the given details below: Activity Preceding Activity Optimistic Time(To) a(Weeks)…
Q: Which of the following is not a project management constrain Select one: O a. Time O b. Safety Oc…
A: Project management constraints are the possible limitations that can happen and that must be taken…
Q: What is the answer
A: Given data is
Q: Gabrielle Kramer, owner of Pet Paradise, is opening a new store in Columbus, Ohie. Her major concem…
A: Given Information:
Q: 15. Answer the questions that follow based on the output below (note: times are in weeks). Project…
A: “Since you have asked multiple question, we will solve the first question for you. If you want any…
Q: 1. The following table contains information on the cost to run three jobs on four available…
A: The question is related to Assignment. In given question is an unbalanced problem of minimization.…
Q: Question 6 Each descending level represents an increasingly detailed definition of the project…
A: WBS or work breakdown structure identifies all the tasks that have to be completed to build the…
Q: It costs $2 to move 1 workpiece 1 foot. What is the cost?
A: Production is the process of converting inputs into outputs. During production, there are various…
Q: Question 1 Activity Activity Description Immediate Predecessors…
A:
Q: 8. How many written days notice must you give an owner before you leave a rented apartment.* A one…
A: Since you have asked multiple questions, we will answer the first question for you. If you want a…
Q: Q. 3 What is the total makespan from Question 1? Question 1: Four floral arranging jobs are to be…
A: Given-
Q: Activity IPA Lag Duration Activity IPA Lag Duration 2 C A 2 D, E 10 A 2 E, F, G 8 3 7 7 В, С 4 K Н,…
A:
Q: Activity Immediate Predecessors Optimistic Time (a) Most Likely Time (m) Pessimistic Time (b)…
A: Given Information: Activity Immediate Predecessors Optimistic Time (a) Most Likely Time…
Q: Activity Pre-act. A B D A,B E F F,C H B H,E H,E D,I, F,C K K
A:
Q: The following information is available for a large fundraising project. Activity Activity Time…
A:
Q: Th e dean of the business school wants to start off eringthis program starting 32 weeks from now.…
A: Probability is the extent to which an event is likely to occur. It is computed by dividing the…
Using your results from Problem 6,
(a) Calculate the probability that the project will be completed
in 38 weeks.
(b) Calculate the probability that the project will be completed
in 42 weeks

Step by step
Solved in 4 steps with 2 images

- Cousins Jeri Lynn DeBose, Tish Hoover, and Josephine (Joey) Parks looked forward to meeting up during the Christmas holidays to compare notes on the results of midyear teacher evaluations. All were public school teachers in districts scattered over the state. In the pressured search for new levels of teacher accountability demanded by legislators, the state department of education joined 16 other States in implementing a new teacher evaluation system. The goal is to hold teachers account-able for student learning progress in the classroom. Under the guidance of the National Council for Teacher Quality, criteria varies by State, but in most cases, 40 percent of each teacher's accountability score would be based on the principal's evaluation and ranking based on personal observation, 30 percent would be based on personal observation by a master teacher from outside the district, and the Other 30 percent would be based on student test score gains. The state department of education would set a performance goal each school district, and the principal would set a performance goal for each teacher. In preparation, the State conducted intensive training sessions for principals and designated master teachers who would conduct the evaluations based on four class observations per teacher. Officials used standardized achievement tests to derive value-added scores that measure student learning over the year. Teacher ratings were 1-5, with I am being the lowest and 5 representing near perfection. The publication of the first year's evaluations stirred interest and controversy, particularly among teachers who worried about the possible long-term effects on job retention and tenure. Now, with the first-year evaluations in hand, the three cousins pored over their experiences. The three represented different types of school systems within the state. Jeri Lynn worked for a metropolitan system in the state capital. The system included many low-income students whose first language was nor English, and several schools within the system were teetering on the brink of State takeover if improvement in student scores didn't materialize this school year. Tish worked in a county System dominated by upper-income residents, and Joey taught in the rural community in which all three grew up. The rural community had high unemployment, and a low percentage of graduates went on to college. As a result, the cousins came to the table with differing teaching experiences. "The numbers are all over the place," Jeri Lynn remarked as she studied the pages. "The whole system is flawed, and they need to make changes," Joey said. " It's too subjective. The principal and master teacher observations are subjective because there are personal factors that affect a true outcome." "Yeah, look at the numbers from your upper-income district," Jeri Lynn said to Tish. " How can 60 percent of the teachers score 5s?" Tish chuckled. "Yeah, lucky us. Our schools are overflowing with children from wealthy families. These are the kids who will apply to Ivy League schools. I can tell you that the principals are going to avoid confrontation on all fronts. No principal is going to give any indication that their students are receiving an education that's less than perfect, and that means cramming the rankings with 5s. They claim a higher level of motivation for students, and thus the selection of an elite team of educators. So with those pressures, I don't think we get personal feedback that IS accurate." "At the other end of the spectrum, we have my rural district," Joey said. "The big problem is that the principals know everyone and have longstanding relationships with everyone in the county, so I think scores are based on personal history. We could almost predict who would get high or low scores before the observations. For principals, it can go back as far as 'his daddy and my daddy hated each other in high school, and now I get to evaluate his daughter." "I think that in many cases, principals feel pressure to align scores with state expectations. The stare expected my district to have high scores and expected rural schools such as yours to be lower," Tish said. "But isn't that partially offset by lower goals for the rural school distracts responded Joey. "The key to the accountability system is the principal in each school," Jeri Lynn suggested. "With several of the schools in Metro teetering on the edge of state takeover by the end of the year, we had lots of strict principals who wanted to hold our feet to the fire with lower scores." "I thought the whole idea was to provide the teachers With feedback so that we would know the areas where we need improvement," Tish said. "The principals were supposed to conduct two observations in the fall and two more in the spring," Jeri Lynn said. think that's asking too much of them when they already have so much on their plates. I think a lot of them are skimping on their visits. know I only had one observation last semester, and I'm sure Mr. Talley just faked the second set of numbers. The master teachers make only two observations a year, which may be more objective but counts for less." "I'm wondering, too, how a principal measure performance in a course area outside his area of expertise, such as math," Joey said. "If the guy has a phobia about math, anything the teacher says or does is going to 100k brilliant—thus a 5." Tish and Jeri Lynn looked at each other and laughed. Maybe we picked the wrong subjects," Tish said. "My question is one of perception," Jeri Lynn said. "A large percentage of my students are ELL. That affects their scores. How do you measure a 3 in my situation against a 5 for Tish? At the end of the school year, little Carlos is thrilled that his reading in English has improved, but there's no Big Bang here. a slow steady improvement that may not actually show up in big strides for a couple of years." "So, the question is how do they create a system that is fair?" Tish asked. "And accurate," added Jeri Lynn. Is a 1-5 grading System by principals and master teachers a valuable part of a feedback control system for teachers? Why?Cousins Jeri Lynn DeBose, Tish Hoover, and Josephine (Joey) Parks looked forward to meeting up during the Christmas holidays to compare notes on the results of midyear teacher evaluations. All were public school teachers in districts scattered over the state. In the pressured search for new levels of teacher accountability demanded by legislators, the state department of education joined 16 other States in implementing a new teacher evaluation system. The goal is to hold teachers account-able for student learning progress in the classroom. Under the guidance of the National Council for Teacher Quality, criteria varies by State, but in most cases, 40 percent of each teacher's accountability score would be based on the principal's evaluation and ranking based on personal observation, 30 percent would be based on personal observation by a master teacher from outside the district, and the Other 30 percent would be based on student test score gains. The state department of education would set a performance goal each school district, and the principal would set a performance goal for each teacher. In preparation, the State conducted intensive training sessions for principals and designated master teachers who would conduct the evaluations based on four class observations per teacher. Officials used standardized achievement tests to derive value-added scores that measure student learning over the year. Teacher ratings were I —5, with I am being the lowest and 5 representing near perfection. The publication of the first year's evaluations stirred interest and controversy, particularly among teachers who worried about the possible long-term effects on job retention and tenure. Now, with the first-year evaluations in hand, the three cousins pored over their experiences. The three represented different types of school systems within the state. Jeri Lynn worked for a metropolitan system in the state capital. The system included many low-income students whose first language was nor English, and several schools within the system were teetering on the brink of State takeover if improvement in student scores didn't materialize this school year. Tish worked in a county System dominated by upper-income residents, and Joey taught in the rural community in which all three grew up. The rural community had high unemployment, and a low percentage of graduates went on to college. As a result, the cousins came to the table with differing teaching experiences. "The numbers are all over the place," Jeri Lynn remarked as she studied the pages. "The whole system is flawed, and they need to make changes," Joey said. " It's too subjective. The principal and master teacher observations are subjective because there are personal factors that affect a true outcome." "Yeah, look at the numbers from your upper-income district," Jeri Lynn said to Tish. "How can 60 percent of the teachers score 5s?" Tish chuckled. "Yeah, lucky us. Our schools are overflowing with children from wealthy families. These are the kids who will apply to Ivy League schools. I can tell you that the principals are going to avoid confrontation on all fronts. No principal is going to give any indication that their students are receiving an education that's less than perfect, and that means cramming the rankings with 5s. They claim a higher level of motivation for students, and thus the selection of an elite team of educators. So with those pressures, I don't think we get personal feedback that IS accurate." "At the other end of the spectrum, we have my rural district," Joey said. "The big problem is that the principals know everyone and have longstanding relationships with everyone in the county, so I think scores are based on personal history. We could almost predict who would get high or low scores before the observations. For principals, it can go back as far as his daddy and my daddy hated each other in high school, and now I get to evaluate his daughter "I think that in many cases, principals feel pressure to align scores with state expectations. The stare expected my district to have high scores and expected rural schools such as yours to be lower," Tish said. "But isn't that partially offset by lower goals for the rural school distracts responded Joey. "The key to the accountability system is the principal in each school," Jeri Lynn suggested. "With several of the schools in Metro teetering on the edge of state takeover by the end of the year, we had lots of strict principals who wanted to hold our feet to the fire with lower scores." "l thought the whole idea was to provide the teachers With feedback so that we would know the areas where we need improvement," Tish said. "The principals were supposed to conduct two observations in the fall and two more in the spring," Jeri Lynn said. think that's asking too much of them when they already have so much on their plates. I think a lot of them are skimping on their visits. know I only had one observation last semester, and I'm sure Mr. Talley just faked the second set of numbers. The master teachers make only two observations a year, which may be more objective but counts for less." "I'm wondering, too, how a principal measure performance in a course area outside his area of expertise, such as math," Joey said. "If the guy has a phobia about math, anything the teacher says or does is going to 100k brilliant—thus a 5." Tish and Jeri Lynn looked at each other and laughed. Maybe we picked the wrong subjects," Tish said. "My question is one of perception," Jeri Lynn said. "A large percentage of my students are ELL. That affects their scores. How do you measure a 3 in my situation against a 5 for Tish? At the end of the school year, little Carlos is thrilled that his reading in English has improved, but there's no Big Bang here. a slow steady improvement that may not actually show up in big strides for a couple of years: "So, the question is how do they create a system that is fair?" Tish asked. "And accurate," added Jeri Lynn. What do you see as the major strengths and flaws in the feedback control system used in the schools in this scenario? What changes do you recommend to overcome the flaws?. Prepare a scatter diagram for each of these data sets and then express in words the apparent relationship between the two variables. Put the first variable on the horizontal axis and the secondvariable on the vertical axis.a. Age 24 30 22 25 33 27 36 58 37 47 54 28 42 55Absenteeism rate 6 5 7 6 4 5 4 1 3 2 2 5 3 1
- b) You are required to interpret the given output. (100 words)Variables Cronbach’s Alpha Discriminant validityCSR Trust Organizationalperformance Employee wellbeingCSR 0.891 0.779 Trust 0.809 0.705 0.749 Organizationalperformance 0.836 0.810 0.683 0.778 Employee wellbeing 0.952 0.645 0.560 0.598 0.823With more than a third of American children and adolescents’ overweight, you would think that Mattel’s slender Barbie doll would be a good role model for little girls. Not so, according to some critics. If Barbie was a real woman, she would have less that 17 percent body fat, a neck too thin to hold her head up, a waist too small to house a full liver and intestines, and ankles and feet too tiny to walk. One group of researchers estimated the likelihood of a woman having Barbie’s body at one in 100,000. Yet some women strive for impossible bodies, with more than 20 million suffering from eating disorders such as anorexia and bulimia. Other research has shown that 40 to 60 percent of preadolescent girls are concerned about their weight, and almost 70 percent of thin models influence their perceptions of an ideal weight. Statistics like these cause consumer advocacy group such as the Campaign for a Commercial-Free Childhood (CCFC) to call for action, especially when targeting young…With more than a third of American children and adolescents overweight, you would think that Mattel’s slender Barbie doll would be a good role model for little girls. Not so, according to some critics. If Barbie was a real woman, she would have less than 17 percent body fat, a neck too thin to hold her head up, a waist too small to house a full liver and intestines, and ankles and feet too tiny to walk. One group of researchers estimated the likelihood of a woman having Barbie’s body at one in 100,000. Yet some women strive for impossible bodies, with more than 20 million suffering from eating disorders such as anorexia and bulimia. Other research has shown that 40 to 60 percent of preadolescent girls are concerned about their weight, and almost 70 percent of elementary-age girls who read magazines say the pictures of thin models influence their perceptions of an ideal weight. Statistics like these cause consumer advocacy groups such as the Campaign for a Commercial-Free Childhood…
- With more than a third of American children and adolescents overweight, you would think that Mattel’s slender Barbie doll would be a good role model for little girls. Not so, according to some critics. If Barbie was a real woman, she would have less than 17 percent body fat, a neck too thin to hold her head up, a waist too small to house a full liver and intestines, and ankles and feet too tiny to walk. One group of researchers estimated the likelihood of a woman having Barbie’s body at one in 100,000. Yet some women strive for impossible bodies, with more than 20 million suffering from eating disorders such as anorexia and bulimia. Other research has shown that 40 to 60 percent of pre-adolescent girls are concerned about their weight, and almost 70 percent of elementary-age girls who read magazines say the pictures of thin models influence their perceptions of an ideal weight. Statistics like these cause consumer advocacy groups such as the Campaign for a Commercial-Free Childhood…1. Management at a U.S. company trying to market tomato paste in the Middle East did not know that, translated into Arabic, tomato paste is “tomato glue.” How could they have known in time to avoid problems? 2. Give examples of how the self-reference criterion might be manifested. QDefine the following:. 1. Leniency Error2. Central Tendency Error3. Strictness Error4. Halo Error5. Proximity Error6. Contrast Error7. Recency Effect
- . Prepare a scatter diagram for each of these data sets and then express in words the apparent relationship between the two variables. Put the first variable on the horizontal axis and the secondvariable on the vertical axis.b. Temperature (°F) 65 63 72 66 82 58 75 86 77 65 79Error rate 1 2 0 0 3 3 1 5 2 1 3COLUMN X COLUMN Y Q.1.2.1 The analyst manipulates certain variables under controlled conditions. A. Statistics Q.1.2.2 Generalises sample findings to the broader population. B. Ordinal-scaled data Q.1.2.3 Describes a characteristic of a sample. C. Statistical modelling Q.1.2.4 Categorical data, where the categories have an implied ranking. D. Inferential statistics Q.1.2.5 Any attribute of interest on which data are collected and analysed. E. Data Q.1.2.6 A set of mathematically based tools & techniques that transform raw data into information to support effective decisionmaking. F. Descriptive statistics Q.1.2.7 The actual values or outcomes recorded on a random variable. G. Parameter Q.1.2.8 Condenses sample data into a few summary measures H. Random variable Q.1.2.9 The collection of all possible observations that exist for the random variable under study. I. Experimentation Q.1.2.10 Describes a characteristic of a population. J. Statistic K. Continuous data L. PopulationWhich test is best to test the hypothesis that multiple variances (2 or more) are equal? Group of answer choices 1. t test 2. proportions test 3. Mood's median test 4. Levene's test 5. Analysis of Variance (ANOVA)