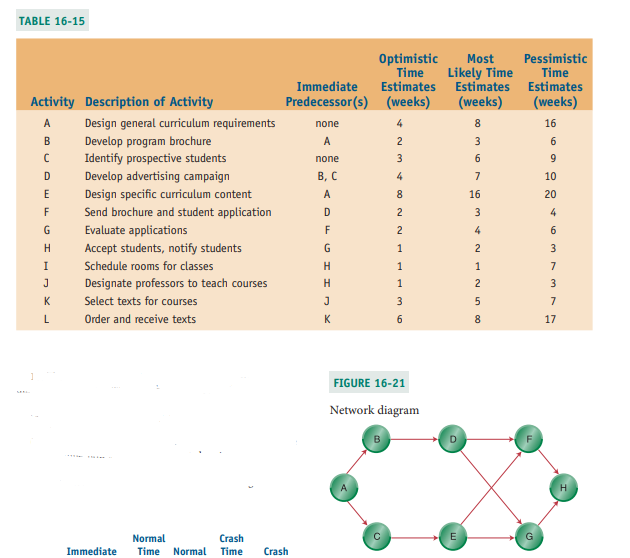
TABLE 16-15 Optimistic Time Pessimistic Time Estimates Estimates Estimates (weeks) Most Likely Time Immediate Activity Description of Activity Predecessor(s) (weeks) (weeks) Design general curriculum requirements Develop program brochure Identify prospective students Develop advertising campaign Design specific curriculum content Send brochure and student application Evaluate applications Accept students, notify students A none 4 8 16 B A 2 3 none 3 6 9 В, с 4 7 10 A 8. 16 20 F D 2 3 4 F 2 H. G 1 2 3 I Schedule rooms for classes H 1 1 7 Designate professors to teach courses H 3 K Select texts for courses 3 5 7 L Order and receive texts K 6 8 17 FIGURE 16-21 Network diagram Normal Crash E Immediate Time Normal Time Crash


Q: PM.52 HCA (Hospital Corporations of America) has obtained 5 new hospitals in a recent acquisition.…
A: Possible path Duration Maximum Critical ABDGIJK 1+5+6+14+12+2+5 = 45 No No ABEHJK 1+5+7+12+2+5…
Q: . Draw a precedence diagram using AOA. b. Find the critical path. c. Determine the expected length…
A: Below is the solution:-
Q: Time Activity Predecessors (Weeks) 4 А 2 C A D В 6. E 2 F D,E 3 What is the duration of the critical…
A: The project network is the network that shows the visual form of the project activities and their…
Q: Question 4. The following table shows the tasks, dependencies, and estimated times a project manager…
A: The Activity on Node diagram is as follows:
Q: Activity Weeks A Inspect the new building, list all required data communications facilities 3 B…
A: A network diagram is a visual representation of a project which helps to identify the critical path…
Q: Using the information given and the project completiontime calculated in Problem 9(a), reduce the…
A: as information provided further to solve a part of question
Q: 1. The R&D department is planning to bid on a large project for the development of a new…
A: A project network is the visual representation of the project activities and their respective…
Q: Consider the following diagram, why is it used and explain what information does it provide to the…
A: The given diagram is Probability and Impact Matrix, which is a tool for the project team to give…
Q: PM.66 Real estate developer Russell Call was working with a few contractors to make a number of…
A: Possible path Duration Maximum Critical A-D-G 3+7+4 = 14 weeks Yes Yes B-E-G 2+6+4 = 12 weeks…
Q: 3.22 Four Squares Productions, a firm hired to coordinate the release of the movie Pirates of the…
A: Given data is
Q: What time should be allowed such that there is a 95% chance of completion within that time?
A: ANSWER IS AS FOLLOWS:
Q: Activity Immediate Predecessors Duration 1 2 3 2 4 4 3 4 4 6. 6 7 6 4 8 4 2 9 8 2 10 7,9 4 11 4 12…
A: Resource leveling: In order to perform resource leveling, an AON (Activity-On-Node) diagram has to…
Q: Consider the following work breakdown structure: Time Estimates (days) Optimistic Most Likely…
A: Critical path analysis (CPA) is a project managerial technique that represents identifying each…
Q: b. Illustration of network analysis of a minor redesign project and its associated packaging.…
A: Given:
Q: using the PERT formula calculate the time value for each activity and construct the network diagram
A: A PERT diagram is a project management took which enables to understand the relationship between…
Q: ind slack time using cpm approach? (10 Activities Time days a m b Immediate predecessor A 3 6 8 - B…
A: Slack Time: Slack time at work is associated with completing an undertaking on schedule. It's…
Q: Activity Time estimate (days) Succeeding Activity A 4 D A E F 11 C G H D,E,F 7 G
A: Network Diagram :
Q: A. Instruction: 1. Construct both AOA diagram for the following data. a) b) Identify the paths and…
A: As per Bartleby guidelines, we can only solve the first three subparts of one question at a…
Q: Using the information given,(a) Calculate the expected time for each of the projectactivities. (b)…
A: Given data is
Q: Q2(a) Choong Machinery specializes in developing grass cutting equipment. Mr Ahmad, who is an R&D…
A: Given data, Solution: Activity Immediate Predecessors Duration A - 6 B - 5 C A 3 D A 2…
Q: op a project network Activity-on-Arrow (AOA) for the club’s tournament preparation process and show…
A: A Small Introduction about Activity-on-Arrow (AOA) In a project plan, ADM is used to schedule…
Q: From the following data of information prepare the (a) Net- work diagram; (b) The Early Start (ES)…
A: 1. During forward pass in case of more than two preceding activities the early start will be…
Q: 1: Program Evaluation Review Technique by using Activity on Arrow Method 2 Critical Path Method…
A: Below is the solution
Q: Construct a network diagram using AON notation
A: GIVEN
Q: Activity (day) Predecessor(s) A 6…
A: A network diagram or the project network diagram is an important tool in project management because…
Q: Q3: The table below includes information about four jobs and three work centers. Please use the…
A: Find the Given details below: Given details: Job Work Center 1 A/2, B/1, C/4 2 C/4, A/2 3…
Q: 1. Design a chart base for the given activities Activity Description Immediate Predecessors A Buy…
A: A set of activities is given {A, B, C, D}. Additionally, the depiction of every activity is given.…
Q: Q.1. Draw AOA diagram and find the critical path. Q.2. What will be the project duration?
A: AOA diagram
Q: 15. Answer the questions that follow based on the output below (note: times are in weeks). Project…
A: “Since you have asked multiple question, we will solve the first question for you. If you want any…
Q: 1. The following table contains information on the cost to run three jobs on four available…
A: The question is related to Assignment. In given question is an unbalanced problem of minimization.…
Q: Activity Immediate Predecessor Time (Weeks) A -- В A C A 4 D A 4 E В C, D D, F F 6 G H D 3 E, G, H 3
A:
Q: EXAMPLE 4: (H.W) Determine the critical path of the following table using the Gantt chart. 25 ,7…
A: In this question, we have got the table data that includes activity ID, Predecessor information and…
Q: Question 6 Each descending level represents an increasingly detailed definition of the project…
A: WBS or work breakdown structure identifies all the tasks that have to be completed to build the…
Q: QUESTION 19 Given the tasks, estimated durations, and crash costs shown below, what is the total…
A: Note: - In the given alternatives, there is no correct answer. Hence, it is a mistake but the…
Q: Thank youuu
A: Since you have posted a question with multiple sub-parts, we will solve the first three subparts for…
Q: How long will the following project take to complete? Task Predecessor Time (days) A None 100 B A 50…
A: In order to find how much time it would take for the project to finish we need to find the Critical…
Q: Task bme estimates for the modification of an assembly line at Jim Goodale's Carbondale, linois,…
A: A Gantt chart usually practiced in project management, is the most widespread and helpful means of…
Q: 1. For cach of the following network diagrams, determine both the critical path and the expected…
A: Since you have posted a question with multiple sub-parts, we will solve the first three subparts for…
Q: 1. Using Microsoft Excel TM prepare a Gantt Chart for the following project. Activity Predecessor(s)…
A: given,
Q: Task Follow Task Weeks (Duration) Task Description Manning Level A Start 1.0 Site Cleaning 3 Obtain…
A: Given data is
Q: QUESTION 19 Given the tasks, estimated durations, and crash costs shown below, what is the total…
A: Find the Given details below: Activity Predecessors Estimated duration (Days) Crash cost per day…
Q: Activity Duration (day) Predecessor (s) Act. A 2 Act. B 3 Act. C 3 А Act. D 4 В Act. E 3 C,D Act. F…
A: Find the given details below: Given Details: Activity Duration(Days) Predecessor A 2 - B 3…
Q: Activity Immediate Predecessors Optimistic Time (a) Most Likely Time (m) Pessimistic Time (b)…
A: Given Information: Activity Immediate Predecessors Optimistic Time (a) Most Likely Time…
Q: Draw Gantt chart for the following project and determine the duration of the project, where the…
A: Find the Given details below: Activity Precedence Activity Quantity or Volume of the…
Q: PM.66 Real estate developer Russell Call was working with a few contractors to make a number of…
A: Given-
Q: 2. Tom Schriber, a director of personnel of Management Resources, Inc., is in the process of…
A: Time variance is a distinction between the standard hours and genuine hours appointed to a task. The…
Q: FEW POINTS ON WORK BREAKDOWN STRUCTURE(WBS) OF HAIR SALOON 1) CONTROL 1.1) Projrct Management 1.2)…
A: The control stage of work breakdown structure is the fourth stage and the project execution takes…
Q: Determine the critical path of the following table using the Gantt chart. Activity Preceded by…
A: Here, we have got the data in tabulated form, this tabulated data includes activity Id, Predecessor,…
Q: Consider a project having the following seven activities: Normal Normal Crash Crash Maximum Time…
A: A network diagram is a visual representation of a project which helps to identify the project…
Th e dean of the business school wants to start off ering
this program starting 32 weeks from now. Using the information
provided in Problem 15,
(a) Calculate the probability of the program starting on
time.
(b) If the dean needs a 95 percent probability of being done
on time, how long can the expected project duration be?


Trending now
This is a popular solution!

Step by step
Solved in 3 steps

- Cousins Jeri Lynn De Bose, Tish Hoover, and Josephine (Joey) Parks looked forward to meeting up during the Christmas holidays to compare notes on the results of midyear teacher evaluations. All were public school teachers in districts scattered over the state. In the pressured search for new levels of teacher accountability demanded by legislators, the state department of education joined 16 other States in implementing a new teacher evaluation system. The goal is to hold teachers account-able for student learning progress in the classroom. Under the guidance of the National Council for Teacher Quality, criteria varies by State, but in most cases, 40 percent of each teacher's accountability score would be based on the principal's evaluation and ranking based on personal observation, 30 percent would be based on personal observation by a master teacher from outside the district, and the Other 30 percent would be based on student test score gains. The state department of education would set a performance goal each school district, and the principal would set a performance goal for each teacher. In preparation, the State conducted intensive training sessions for principals and designated master teachers who would conduct the evaluations based on four class observations per teacher Officials used standardized achievement tests to derive value-added scores that measure student learning over the year. Teacher ratings were 1-5, with I am being the lowest and 5 representing near perfection. The publication of the first year's evaluations stirred interest and controversy, particularly among teachers who worried about the possible long-term effects on job retention and tenure. Now, with the first-year evaluations in hand, the three cousins pored over their experiences. The three represented different types of school systems within the state. Jeri Lynn worked for a metropolitan system in the state capital. The system included many low-income students whose first language was nor English, and several schools within the system were teetering on the brink of State takeover if improvement in student scores didn't materialize this school year. Tish worked in a county System dominated by upper-income residents, and Joey taught in the rural community in which all three grew up. The rural community had high unemployment, and a low percentage of graduates went on to college. As a result, the cousins came to the table with differing teaching experiences. "The numbers are all over the place," Jeri Lynn remarked as she studied the pages. "The whole system is flawed, and they need to make changes," Joey said. "It's too subjective. The principal and master teacher observations are subjective because there are personal factors that affect a true outcome." "Yeah, look at the numbers from your upper-income district," Jeri Lynn said to Tish. "How can 60 percent of the teachers score 5s?' Tish chuckled. "Yeah, lucky us. Our schools are overflowing with children from wealthy families. These are the kids who will apply to Ivy League schools. I can tell you that the principals are going to avoid confrontation on all fronts. No principal is going to give any indication that their students are receiving an education that's less than perfect, and that means cramming the rankings with 5s. They claim a higher level of motivation for students, and thus the selection of an elite team of educators. So with those pressures, I don't think we get personal feedback that is accurate." "At the other end of the spectrum, we have my rural district," Joey said. "The big problem is that the principals know everyone and have longstanding relationships with everyone in the county, so I think scores are based on personal history. We could almost predict who would get high or low scores before the observations. For principals, it can go back as far as 'his daddy and my daddy hated each other in high school, and now I get to evaluate his daughter "I think that in many cases, principals feel pressure to align scores with state expectations. The stare expected my district to have high scores and expected rural schools such as yours to be lower," Tish said. "But isn't that partially offset by lower goals for the rural school distracts responded Joey. "The key to the accountability system is the principal in each school," Jeri Lynn suggested. "With several of the schools in Metro teetering on the edge of state takeover by the end of the year, we had lots of strict principals who wanted to hold our feet to the fire with lower scores." "I thought the whole idea was to provide the teachers With feedback so that we would know the areas where we need improvement," Tish said. "The principals were supposed to conduct two observations in the fall and two more in the spring," Jeri Lynn said. think that's asking too much of them when they already have so much on their plates. I think a lot of them are skimping on their visits. know I only had one observation last semester, and I'm sure Mr. Talley just faked the second set of numbers. The master teachers make only two observations a year, which may be more objective but counts for less." "I'm wondering, too, how a principal measure performance in a course area outside his area of expertise, such as math," Joey said. "If the guy has a phobia about math, anything the teacher says or does is going to 100k brilliant-thus a 5." Tish and Jeri Lynn looked at each other and laughed. "Maybe we picked the wrong subjects," Tish said. "My question is one of perception," Jeri Lynn said. "A large percentage of my students are ELL. That affects their scores. How do you measure a 3 in my situation against a 5 for Tish? At the end of the school year, little Carlos is thrilled that his reading in English has improved, but there`s no Big Bang here. a slow steady improvement that may not actually show up in big strides for a couple of years: "So, the question is how do they create a system that is fair?" Tish asked. "And accurate," added Jeri Lynn. How might the state control the accuracy of principals who are conducting teacher evaluations? Explain.Cousins Jeri Lynn DeBose, Tish Hoover, and Josephine (Joey) Parks looked forward to meeting up during the Christmas holidays to compare notes on the results of midyear teacher evaluations. All were public school teachers in districts scattered over the state. In the pressured search for new levels of teacher accountability demanded by legislators, the state department of education joined 16 other States in implementing a new teacher evaluation system. The goal is to hold teachers account-able for student learning progress in the classroom. Under the guidance of the National Council for Teacher Quality, criteria varies by State, but in most cases, 40 percent of each teacher's accountability score would be based on the principal's evaluation and ranking based on personal observation, 30 percent would be based on personal observation by a master teacher from outside the district, and the Other 30 percent would be based on student test score gains. The state department of education would set a performance goal each school district, and the principal would set a performance goal for each teacher. In preparation, the State conducted intensive training sessions for principals and designated master teachers who would conduct the evaluations based on four class observations per teacher. Officials used standardized achievement tests to derive value-added scores that measure student learning over the year. Teacher ratings were 1-5, with I am being the lowest and 5 representing near perfection. The publication of the first year's evaluations stirred interest and controversy, particularly among teachers who worried about the possible long-term effects on job retention and tenure. Now, with the first-year evaluations in hand, the three cousins pored over their experiences. The three represented different types of school systems within the state. Jeri Lynn worked for a metropolitan system in the state capital. The system included many low-income students whose first language was nor English, and several schools within the system were teetering on the brink of State takeover if improvement in student scores didn't materialize this school year. Tish worked in a county System dominated by upper-income residents, and Joey taught in the rural community in which all three grew up. The rural community had high unemployment, and a low percentage of graduates went on to college. As a result, the cousins came to the table with differing teaching experiences. "The numbers are all over the place," Jeri Lynn remarked as she studied the pages. "The whole system is flawed, and they need to make changes," Joey said. " It's too subjective. The principal and master teacher observations are subjective because there are personal factors that affect a true outcome." "Yeah, look at the numbers from your upper-income district," Jeri Lynn said to Tish. " How can 60 percent of the teachers score 5s?" Tish chuckled. "Yeah, lucky us. Our schools are overflowing with children from wealthy families. These are the kids who will apply to Ivy League schools. I can tell you that the principals are going to avoid confrontation on all fronts. No principal is going to give any indication that their students are receiving an education that's less than perfect, and that means cramming the rankings with 5s. They claim a higher level of motivation for students, and thus the selection of an elite team of educators. So with those pressures, I don't think we get personal feedback that IS accurate." "At the other end of the spectrum, we have my rural district," Joey said. "The big problem is that the principals know everyone and have longstanding relationships with everyone in the county, so I think scores are based on personal history. We could almost predict who would get high or low scores before the observations. For principals, it can go back as far as 'his daddy and my daddy hated each other in high school, and now I get to evaluate his daughter." "I think that in many cases, principals feel pressure to align scores with state expectations. The stare expected my district to have high scores and expected rural schools such as yours to be lower," Tish said. "But isn't that partially offset by lower goals for the rural school distracts responded Joey. "The key to the accountability system is the principal in each school," Jeri Lynn suggested. "With several of the schools in Metro teetering on the edge of state takeover by the end of the year, we had lots of strict principals who wanted to hold our feet to the fire with lower scores." "I thought the whole idea was to provide the teachers With feedback so that we would know the areas where we need improvement," Tish said. "The principals were supposed to conduct two observations in the fall and two more in the spring," Jeri Lynn said. think that's asking too much of them when they already have so much on their plates. I think a lot of them are skimping on their visits. know I only had one observation last semester, and I'm sure Mr. Talley just faked the second set of numbers. The master teachers make only two observations a year, which may be more objective but counts for less." "I'm wondering, too, how a principal measure performance in a course area outside his area of expertise, such as math," Joey said. "If the guy has a phobia about math, anything the teacher says or does is going to 100k brilliant—thus a 5." Tish and Jeri Lynn looked at each other and laughed. Maybe we picked the wrong subjects," Tish said. "My question is one of perception," Jeri Lynn said. "A large percentage of my students are ELL. That affects their scores. How do you measure a 3 in my situation against a 5 for Tish? At the end of the school year, little Carlos is thrilled that his reading in English has improved, but there's no Big Bang here. a slow steady improvement that may not actually show up in big strides for a couple of years." "So, the question is how do they create a system that is fair?" Tish asked. "And accurate," added Jeri Lynn. Is a 1-5 grading System by principals and master teachers a valuable part of a feedback control system for teachers? Why?Cousins Jeri Lynn DeBose, Tish Hoover, and Josephine (Joey) Parks looked forward to meeting up during the Christmas holidays to compare notes on the results of midyear teacher evaluations. All were public school teachers in districts scattered over the state. In the pressured search for new levels of teacher accountability demanded by legislators, the state department of education joined 16 other States in implementing a new teacher evaluation system. The goal is to hold teachers account-able for student learning progress in the classroom. Under the guidance of the National Council for Teacher Quality, criteria varies by State, but in most cases, 40 percent of each teacher's accountability score would be based on the principal's evaluation and ranking based on personal observation, 30 percent would be based on personal observation by a master teacher from outside the district, and the Other 30 percent would be based on student test score gains. The state department of education would set a performance goal each school district, and the principal would set a performance goal for each teacher. In preparation, the State conducted intensive training sessions for principals and designated master teachers who would conduct the evaluations based on four class observations per teacher. Officials used standardized achievement tests to derive value-added scores that measure student learning over the year. Teacher ratings were I —5, with I am being the lowest and 5 representing near perfection. The publication of the first year's evaluations stirred interest and controversy, particularly among teachers who worried about the possible long-term effects on job retention and tenure. Now, with the first-year evaluations in hand, the three cousins pored over their experiences. The three represented different types of school systems within the state. Jeri Lynn worked for a metropolitan system in the state capital. The system included many low-income students whose first language was nor English, and several schools within the system were teetering on the brink of State takeover if improvement in student scores didn't materialize this school year. Tish worked in a county System dominated by upper-income residents, and Joey taught in the rural community in which all three grew up. The rural community had high unemployment, and a low percentage of graduates went on to college. As a result, the cousins came to the table with differing teaching experiences. "The numbers are all over the place," Jeri Lynn remarked as she studied the pages. "The whole system is flawed, and they need to make changes," Joey said. " It's too subjective. The principal and master teacher observations are subjective because there are personal factors that affect a true outcome." "Yeah, look at the numbers from your upper-income district," Jeri Lynn said to Tish. "How can 60 percent of the teachers score 5s?" Tish chuckled. "Yeah, lucky us. Our schools are overflowing with children from wealthy families. These are the kids who will apply to Ivy League schools. I can tell you that the principals are going to avoid confrontation on all fronts. No principal is going to give any indication that their students are receiving an education that's less than perfect, and that means cramming the rankings with 5s. They claim a higher level of motivation for students, and thus the selection of an elite team of educators. So with those pressures, I don't think we get personal feedback that IS accurate." "At the other end of the spectrum, we have my rural district," Joey said. "The big problem is that the principals know everyone and have longstanding relationships with everyone in the county, so I think scores are based on personal history. We could almost predict who would get high or low scores before the observations. For principals, it can go back as far as his daddy and my daddy hated each other in high school, and now I get to evaluate his daughter "I think that in many cases, principals feel pressure to align scores with state expectations. The stare expected my district to have high scores and expected rural schools such as yours to be lower," Tish said. "But isn't that partially offset by lower goals for the rural school distracts responded Joey. "The key to the accountability system is the principal in each school," Jeri Lynn suggested. "With several of the schools in Metro teetering on the edge of state takeover by the end of the year, we had lots of strict principals who wanted to hold our feet to the fire with lower scores." "l thought the whole idea was to provide the teachers With feedback so that we would know the areas where we need improvement," Tish said. "The principals were supposed to conduct two observations in the fall and two more in the spring," Jeri Lynn said. think that's asking too much of them when they already have so much on their plates. I think a lot of them are skimping on their visits. know I only had one observation last semester, and I'm sure Mr. Talley just faked the second set of numbers. The master teachers make only two observations a year, which may be more objective but counts for less." "I'm wondering, too, how a principal measure performance in a course area outside his area of expertise, such as math," Joey said. "If the guy has a phobia about math, anything the teacher says or does is going to 100k brilliant—thus a 5." Tish and Jeri Lynn looked at each other and laughed. Maybe we picked the wrong subjects," Tish said. "My question is one of perception," Jeri Lynn said. "A large percentage of my students are ELL. That affects their scores. How do you measure a 3 in my situation against a 5 for Tish? At the end of the school year, little Carlos is thrilled that his reading in English has improved, but there's no Big Bang here. a slow steady improvement that may not actually show up in big strides for a couple of years: "So, the question is how do they create a system that is fair?" Tish asked. "And accurate," added Jeri Lynn. What do you see as the major strengths and flaws in the feedback control system used in the schools in this scenario? What changes do you recommend to overcome the flaws?
- 1) what is the Importance of problem formulationProblem definition & project objectives2. what are the steps in data science (analytics) problem solving approachExplain basic steps & important aspects44. A new car dealership is considering opening branches in three of the largest cities in the state. As the expansion will require the hiring of new employees, the owners want to make sure that future customer demand for cars will be stable. Which factor in human capital planning would be important in this scenario? A.Competitor forecasts B.Interest rates forecasts C.Economic forecasts D.Production forecastsEnd-of-Chapter Application Case Why is beer flavor important to Coors’ profitability? What is the objective of the neural network used at Coors? Why were the results of Coors’ neural network initially poor, and what was done to improve the results? What benefits might Coors derive if this project is successful? What modifications would you make to improve the results of beer flavor prediction?
- Paraphase this one. Make it longer. Predictive analytics is the process of using data to forecast future outcomes. The process uses data analysis, machine learning, artificial intelligence, and statistical models to find patterns that might predict future behavior. Organizations can use historic and current data to forecast trends and behaviors seconds, days, or years into the future with a great deal of precision.______________ is the process of estimating the size of the staff needed to meet a company's overall goals. a) forecasting b) guesstimating c) proportioning d) right-sizingbrief notes on differences between budgeting and forecasting, and feedback loop
- 24. Method of administering the questionnaire includes: A. Convening all concerned respondents one at a time. B. Allowing respondents to self-administer the questionnaire. C. Uploading questionnaires on print media. D. Allowing respondents to administer questionnaires. 25. The first question on the questionnaire should be: A. Cluster. B. Controversial. C. Important D. Insignificant. Part (III) Give Short Answer For The Following Questions ) 1. Explain closed questions and open-ended questions with examples. 2. What planning dimensions determine information system development? Elaborate. 3. Why is it difficult to determine user requirements. 4. What is the purpose of preliminary investigation. 5. What is an infeasible project and how are they handled. 6. Elaborate System performance. 7. Explain economic, technical & behavioral feasibility. 8. Explain the importance of oral presentation. 9. Briefly discus the various steps in Feasibility Analysis. 10. What is the…What factors make forecasting at Deckers particularly challenging? Howcan forecasts be made for seasonal, fashionable products for whichthere is no history file? What are the costs of over-forecasting demandfor such items? Under-forecasting?18. When Creamy Layer Inc. planned to introduce a new ice cream flavor, its senior executives looked at the sales history of earlier introductions to forecast the sales for the newest flavor. This is an example of an analogy approach for new product forecasting. Select one: O True O False