Multiple Regression Output from EXCEL is shown below at alpha 0.05 SUMMARY OUTPUT Regression Statistics Multiple R 0.99868 R Square 0.99736 Adjusted R Square 0.99670 Standard Error 0.00883 Observations 11 ANOVA df SS MS Significance F Regression 2 0.2356346 4.877E-11 Residual 8 0.0006243 Total 10 0.2362589 Coefficients Standard Error t Stat P-value Lower 95% Upper 95% Lower 95.0% Upper 95. Intercept -0.11050 0.25007 -0.44187 0.67028 -0.68716 0.46616 -0.68716 0.4661 Dielectric Constant 0.40717 0.16817 2.42120 0.04177 0.01937 0.79497 0.01937 0.7949 Loss Factor 2.10797 5.83362 0.36135 0.72720 -11.34438 15.56032 -11.34438 15.5603
Multiple Regression Output from EXCEL is shown below at alpha 0.05 SUMMARY OUTPUT Regression Statistics Multiple R 0.99868 R Square 0.99736 Adjusted R Square 0.99670 Standard Error 0.00883 Observations 11 ANOVA df SS MS Significance F Regression 2 0.2356346 4.877E-11 Residual 8 0.0006243 Total 10 0.2362589 Coefficients Standard Error t Stat P-value Lower 95% Upper 95% Lower 95.0% Upper 95. Intercept -0.11050 0.25007 -0.44187 0.67028 -0.68716 0.46616 -0.68716 0.4661 Dielectric Constant 0.40717 0.16817 2.42120 0.04177 0.01937 0.79497 0.01937 0.7949 Loss Factor 2.10797 5.83362 0.36135 0.72720 -11.34438 15.56032 -11.34438 15.5603

Glencoe Algebra 1, Student Edition, 9780079039897, 0079039898, 2018
18th Edition
ISBN:9780079039897
Author:Carter
Publisher:Carter
Chapter10: Statistics
Section10.1: Measures Of Center
Problem 9PPS

Related questions
Question
41
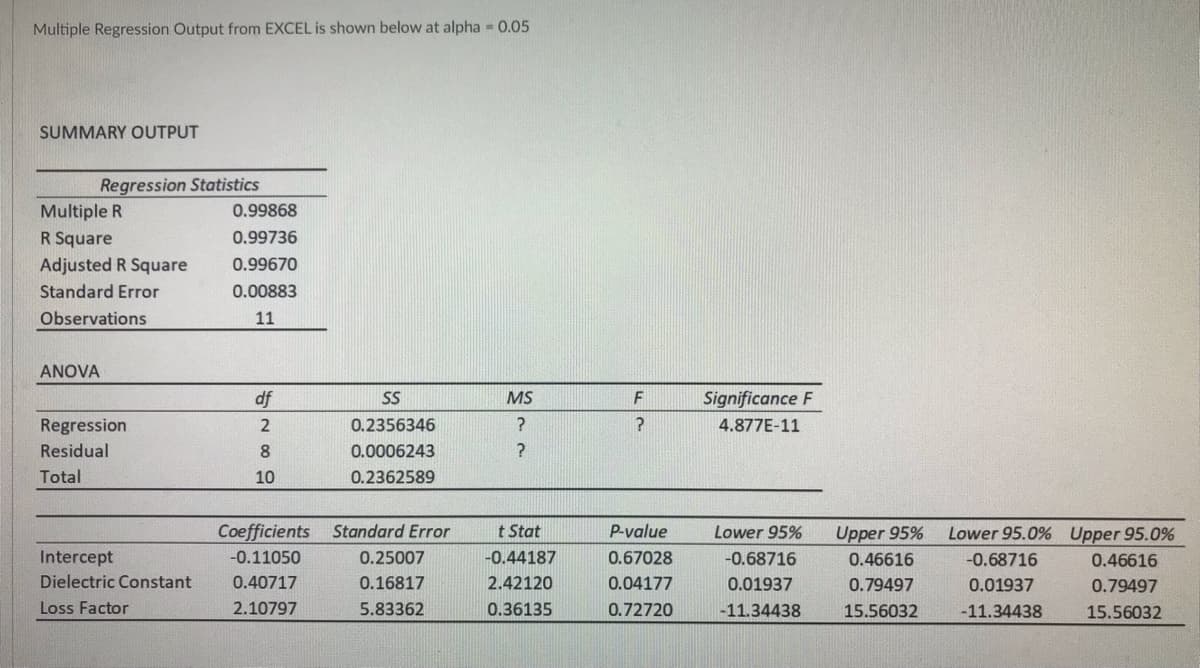
Transcribed Image Text:Multiple Regression Output from EXCEL is shown below at alpha 0.05
SUMMARY OUTPUT
Regression Statistics
Multiple R
0.99868
R Square
0.99736
Adjusted R Square
0.99670
Standard Error
0.00883
Observations
11
ANOVA
df
SS
MS
Significance F
Regression
2
0.2356346
4.877E-11
Residual
8
0.0006243
Total
10
0.2362589
Coefficients
Standard Error
t Stat
P-value
Lower 95%
Upper 95%
Lower 95.0% Upper 95.0%
Intercept
-0.11050
0.25007
-0.44187
0.67028
-0.68716
0.46616
-0.68716
0.46616
Dielectric Constant
0.40717
0.16817
2.42120
0.04177
0.01937
0.79497
0.01937
0.79497
Loss Factor
2.10797
5.83362
0.36135
0.72720
-11.34438
15.56032
-11.34438
15.56032
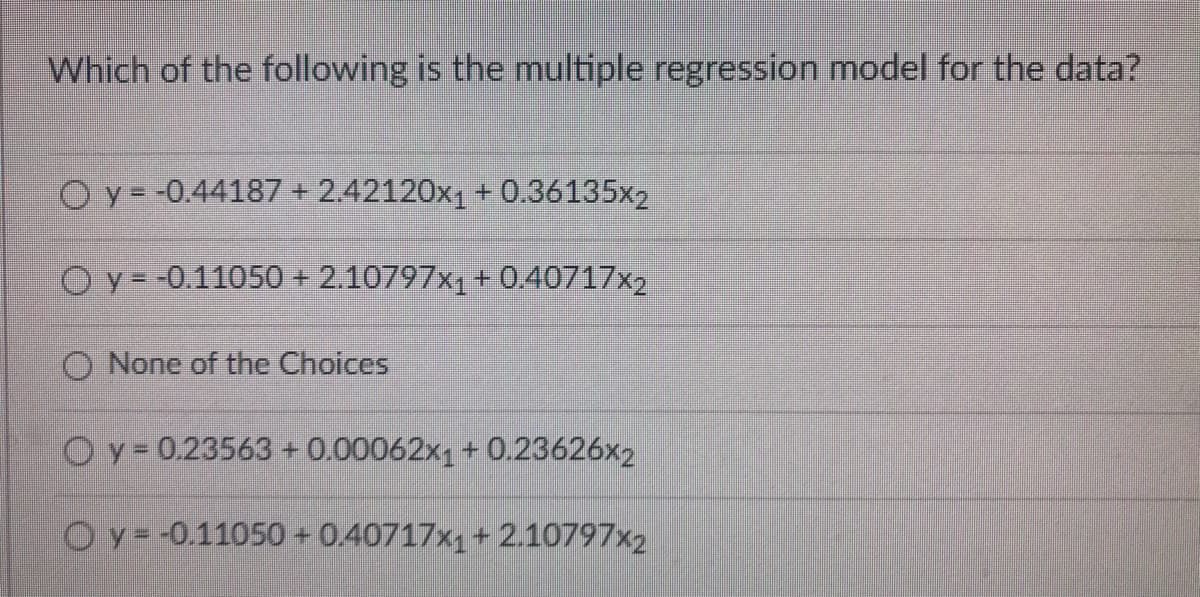
Transcribed Image Text:Which of the following is the multiple regression model for the data?
Oy= -0.44187 + 2.42120x1 + 0.36135x2
Oy- -0.11050 + 2.10797x1+ 0.40717x2
O None of the Choices
Oy= 0.23563+0.00062x, + 0.23626x2
Oy=-0.11050 + 0.40717x1+ 2.10797x2
Expert Solution
This question has been solved!
Explore an expertly crafted, step-by-step solution for a thorough understanding of key concepts.

Step by step
Solved in 2 steps

Recommended textbooks for you
Glencoe Algebra 1, Student Edition, 9780079039897…
Algebra
ISBN:
9780079039897
Author:
Carter
Publisher:
McGraw Hill

College Algebra
Algebra
ISBN:
9781305115545
Author:
James Stewart, Lothar Redlin, Saleem Watson
Publisher:
Cengage Learning
Glencoe Algebra 1, Student Edition, 9780079039897…
Algebra
ISBN:
9780079039897
Author:
Carter
Publisher:
McGraw Hill
College Algebra
Algebra
ISBN:
9781305115545
Author:
James Stewart, Lothar Redlin, Saleem Watson
Publisher:
Cengage Learning