a. Complete the missing entries in this Excel Regression tool output. Enter negative values as negative numbers. ANOVA df SS MS Significance F Regression 1.7621 2. 0.88105 Residual .1179 0.01685 Total 1.88 Coefficients Standard Error t Stat P-value Intercept -1.4053 0.4848 0.24 X1 0.0235 0.0087 0.0302 X2 0.0049 0.0011 0.003
a. Complete the missing entries in this Excel Regression tool output. Enter negative values as negative numbers. ANOVA df SS MS Significance F Regression 1.7621 2. 0.88105 Residual .1179 0.01685 Total 1.88 Coefficients Standard Error t Stat P-value Intercept -1.4053 0.4848 0.24 X1 0.0235 0.0087 0.0302 X2 0.0049 0.0011 0.003

Chapter4: Linear Functions
Section: Chapter Questions
Problem 30PT: For the following exercises, use Table 4 which shows the percent of unemployed persons 25 years or...

Related questions

Topic Video
Question
I need help with my assignment.
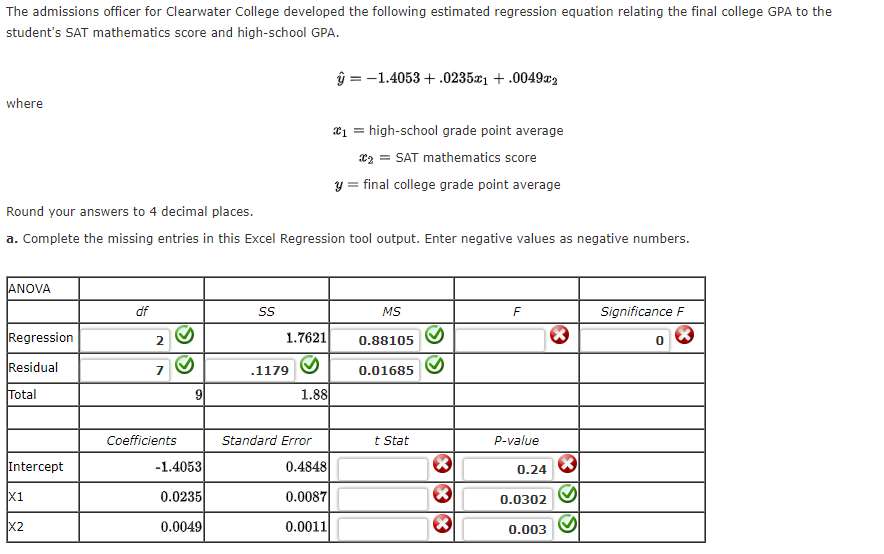
Transcribed Image Text:The admissions officer for Clearwater College developed the following estimated regression equation relating the final college GPA to the
student's SAT mathematics score and high-school GPA.
ŷ = -1.4053 + .0235x1 + .0049x2
where
= high-school grade point average
xz = SAT mathematics score
y = final college grade point average
Round your answers to 4 decimal places.
a. Complete the missing entries in this Excel Regression tool output. Enter negative values as negative numbers.
ANOVA
df
MS
F
Significance F
Regression
2
1.7621
0.88105
Residual
.1179
0.01685
Total
1.88
Coefficients
Standard Error
t Stat
P-value
Intercept
-1.4053
0.4848
0.24
x1
0.0235
0.0087
0.0302
X2
0.0049
0.0011
0.003
Expert Solution
This question has been solved!
Explore an expertly crafted, step-by-step solution for a thorough understanding of key concepts.

This is a popular solution!

Trending now
This is a popular solution!

Step by step
Solved in 2 steps with 4 images

Knowledge Booster


Learn more about
Need a deep-dive on the concept behind this application? Look no further. Learn more about this topic, statistics and related others by exploring similar questions and additional content below.Recommended textbooks for you

Functions and Change: A Modeling Approach to Coll…
Algebra
ISBN:
9781337111348
Author:
Bruce Crauder, Benny Evans, Alan Noell
Publisher:
Cengage Learning
Functions and Change: A Modeling Approach to Coll…
Algebra
ISBN:
9781337111348
Author:
Bruce Crauder, Benny Evans, Alan Noell
Publisher:
Cengage Learning