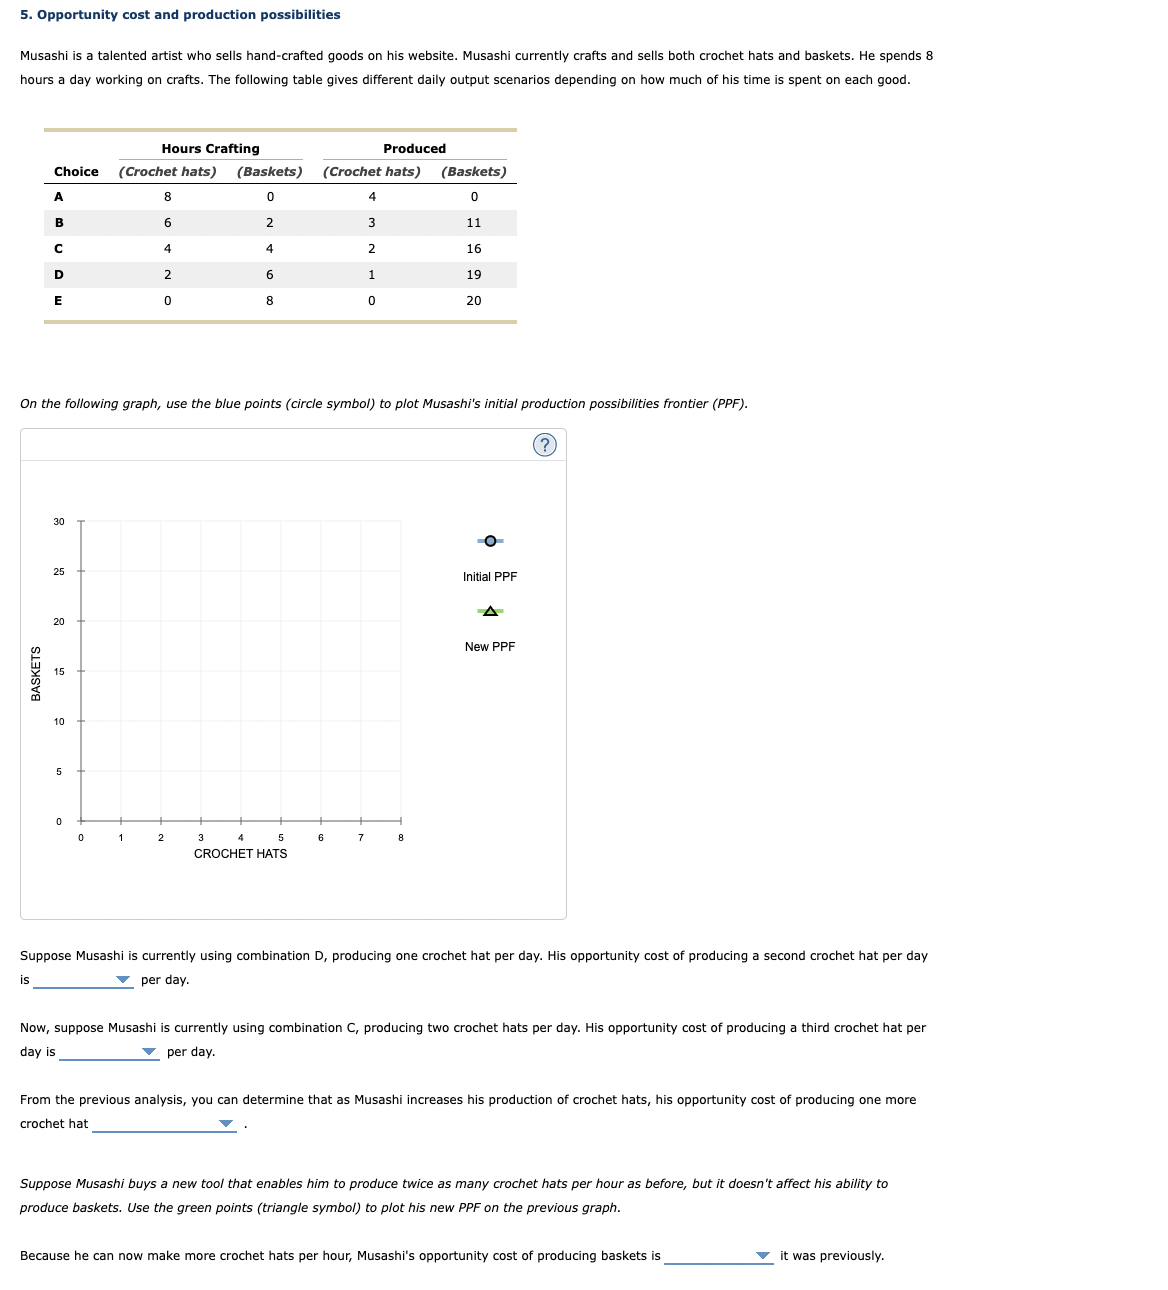
Musashi is a talented artist who sells hand-crafted goods on his website. Musashi currently crafts and sells both crochet hats and baskets. He spends 8 hours a day working on crafts. The following table gives different daily output scenarios depending on how much of his time is spent on each good. BASKETS Hours Crafting Produced Choice (Crochet hats) (Baskets) (Crochet hats) (Baskets) 0 0 11 16 A B с D E is 30 On the following graph, use the blue points (circle symbol) to plot Musashi's initial production possibilities frontier (PPF). 25 20 15 10 5 0 0 8 6 4 2 0 1 2 2 4 6 8 3 5 CROCHET HATS 4 6 4 3 2 1 0 7 19 20 8 O Initial PPF New PPF (?) Suppose Musashi is currently using combination D, producing one crochet hat per day. His opportunity cost of producing a second crochet hat per day ▼per day. Now, suppose Musashi is currently using combination C, producing two crochet hats per day. His opportunity cost of producing a third crochet hat per day is ▼per day. From the previous analysis, you can determine that as Musashi increases his production of crochet hats, his opportunity cost of producing one more crochet hat Suppose Musashi buys a new tool that enables him to produce twice as many crochet hats per hour as before, but it doesn't affect his ability to produce baskets. Use the green points (triangle symbol) to plot his new PPF on the previous graph. Because he can now make more crochet hats per hour, Musashi's opportunity cost of producing baskets is it was previously.
Musashi is a talented artist who sells hand-crafted goods on his website. Musashi currently crafts and sells both crochet hats and baskets. He spends 8 hours a day working on crafts. The following table gives different daily output scenarios depending on how much of his time is spent on each good. BASKETS Hours Crafting Produced Choice (Crochet hats) (Baskets) (Crochet hats) (Baskets) 0 0 11 16 A B с D E is 30 On the following graph, use the blue points (circle symbol) to plot Musashi's initial production possibilities frontier (PPF). 25 20 15 10 5 0 0 8 6 4 2 0 1 2 2 4 6 8 3 5 CROCHET HATS 4 6 4 3 2 1 0 7 19 20 8 O Initial PPF New PPF (?) Suppose Musashi is currently using combination D, producing one crochet hat per day. His opportunity cost of producing a second crochet hat per day ▼per day. Now, suppose Musashi is currently using combination C, producing two crochet hats per day. His opportunity cost of producing a third crochet hat per day is ▼per day. From the previous analysis, you can determine that as Musashi increases his production of crochet hats, his opportunity cost of producing one more crochet hat Suppose Musashi buys a new tool that enables him to produce twice as many crochet hats per hour as before, but it doesn't affect his ability to produce baskets. Use the green points (triangle symbol) to plot his new PPF on the previous graph. Because he can now make more crochet hats per hour, Musashi's opportunity cost of producing baskets is it was previously.

Brief Principles of Macroeconomics (MindTap Course List)
8th Edition
ISBN:9781337091985
Author:N. Gregory Mankiw
Publisher:N. Gregory Mankiw
Chapter2: Thinking Like An Economist
Section: Chapter Questions
Problem 3PA

Related questions
Question
Transcribed Image Text:5. Opportunity cost and production possibilities
Musashi is a talented artist who sells hand-crafted goods on his website. Musashi currently crafts and sells both crochet hats and baskets. He spends 8
hours a day working on crafts. The following table gives different daily output scenarios depending on how much of his time is spent on each good.
BASKETS
Hours Crafting
Produced
Choice (Crochet hats) (Baskets) (Crochet hats)
0
A
B
is
C
D
E
30
25
10
5
0
8
0
6
On the following graph, use the blue points (circle symbol) to plot Musashi's initial production possibilities frontier (PPF).
4
2
0
2
2
4
6
8
3
4
5
CROCHET HATS
3
2
1
0
(Baskets)
0
11
16
19
20
8
Initial PPF
New PPF
?
Suppose Musashi is currently using combination D, producing one crochet hat per day. His opportunity cost of producing a second crochet hat per day
per day.
Now, suppose Musashi is currently using combination C, producing two crochet hats per day. His opportunity cost of producing a third crochet hat per
day is
▼per day.
From the previous analysis, you can determine that as Musashi increases his production of crochet hats, his opportunity cost of producing one more
crochet hat
Suppose Musashi buys a new tool that enables him to produce twice as many crochet hats per hour as before, but it doesn't affect his ability to
produce baskets. Use the green points (triangle symbol) to plot his new PPF on the previous graph.
Because he can now make more crochet hats per hour, Musashi's opportunity cost of producing baskets is
it was previously.
Expert Solution
This question has been solved!
Explore an expertly crafted, step-by-step solution for a thorough understanding of key concepts.

This is a popular solution!

Trending now
This is a popular solution!

Step by step
Solved in 7 steps with 5 images

Knowledge Booster


Learn more about
Need a deep-dive on the concept behind this application? Look no further. Learn more about this topic, economics and related others by exploring similar questions and additional content below.Recommended textbooks for you
Brief Principles of Macroeconomics (MindTap Cours…
Economics
ISBN:
9781337091985
Author:
N. Gregory Mankiw
Publisher:
Cengage Learning


Principles of Economics 2e
Economics
ISBN:
9781947172364
Author:
Steven A. Greenlaw; David Shapiro
Publisher:
OpenStax
Brief Principles of Macroeconomics (MindTap Cours…
Economics
ISBN:
9781337091985
Author:
N. Gregory Mankiw
Publisher:
Cengage Learning
Principles of Economics 2e
Economics
ISBN:
9781947172364
Author:
Steven A. Greenlaw; David Shapiro
Publisher:
OpenStax


Essentials of Economics (MindTap Course List)
Economics
ISBN:
9781337091992
Author:
N. Gregory Mankiw
Publisher:
Cengage Learning