Isorevenue lines What does the graph above indicate? Choose Isocost lines 4 Labor An Isoquant The least cost combination of inputs The least cost combination of outputs
Isorevenue lines What does the graph above indicate? Choose Isocost lines 4 Labor An Isoquant The least cost combination of inputs The least cost combination of outputs

Principles of Economics 2e
2nd Edition
ISBN:9781947172364
Author:Steven A. Greenlaw; David Shapiro
Publisher:Steven A. Greenlaw; David Shapiro
Chapter7: Production, Costs, And Industry Structure
Section: Chapter Questions
Problem 25RQ: In choosing a production technology, how will firms react if one input becomes relatively more...

Related questions

Question
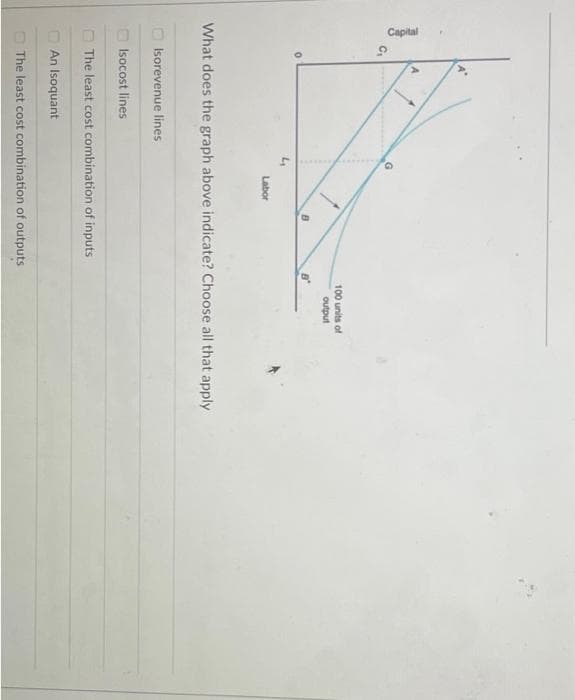
Transcribed Image Text:Capital
9
Isorevenue lines
O
Isocost lines
Labor
B
What does the graph above indicate? Choose all that apply
The least cost combination of inputs
100 units of
output
An Isoquant
The least cost combination of outputs
8°
Expert Solution
This question has been solved!
Explore an expertly crafted, step-by-step solution for a thorough understanding of key concepts.

Step by step
Solved in 3 steps

Knowledge Booster


Learn more about
Need a deep-dive on the concept behind this application? Look no further. Learn more about this topic, economics and related others by exploring similar questions and additional content below.Recommended textbooks for you
Principles of Economics 2e
Economics
ISBN:
9781947172364
Author:
Steven A. Greenlaw; David Shapiro
Publisher:
OpenStax
Principles of Economics 2e
Economics
ISBN:
9781947172364
Author:
Steven A. Greenlaw; David Shapiro
Publisher:
OpenStax