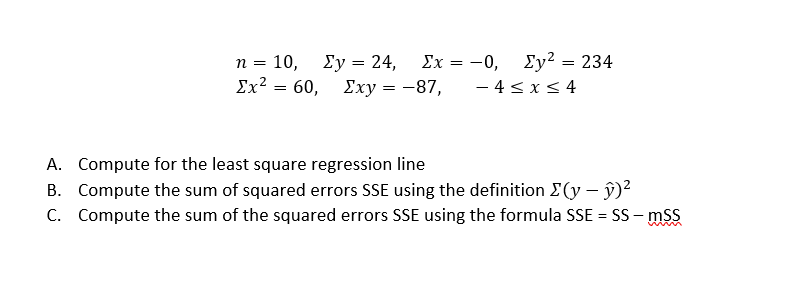
n= 10, Σν-24, Σx-0, Σχ260, Σxχy-87, - 4


Q: Use the t-distribution to find a confidence interval for a difference in means estimate for a…
A:
Q: Tourism is extremely important to the economy of Florida. Hotel occupancy is an often-reported…
A: According our policy we can answer only first three subpart for remaining please repost the…
Q: 1. Marcela and Lorenza agreed to go under one-month observation period. During the time, the fashion…
A: given that, Marcela and Lorenza agreed to go under one-month observation period. During the time,…
Q: How do I calculate the test statistic? n1=45; n2= 50 x1= 4.7 mins; x2 = 5 mins s1=1.1 mins; sx -…
A: Solution-: Given: n1=45,n2=50,x1¯=4.7,x2¯=5,s1=1.1,s2=1.0,α=0.05 We find the test statistic=?
Q: Jump to level 1 A software company is interested in improving customer satisfaction rate from the…
A: Introduction: Population Proportion: The population proportion is the ratio of the number of items…
Q: The body temperatures in degrees Fahrenheit of a sample of adults in one small town are: 97.5 99.1…
A: We have given the following data about the body temperature.
Q: Construct a 90% confidence interval to estimate the population proportion with a sample proportion…
A: Given
Q: Compare the probabilities assuming a Poisson distribution to your answers in part a. Divide each…
A: This question based on poisson probability distribution and frequency distribution of the data.…
Q: The next seven questions refer to the following scenario: A random sample of 16 Porsche drivers…
A: Given that, a random sample of 16 Porsche drivers yielded an average age of 50 years with a variance…
Q: You'd like to test the null hypothesis that the means of the two samples (column A and column B) are…
A: Test Statistic for testing 2 means t is given by, t= H0: The means of X1 and X2 are same. H1:…
Q: 13% of all Americans suffer from sleep apnea. A researcher suspects that a lower percentage of those…
A:
Q: Each of 150 newly manufactured items is examined and the number of scratches per item is recorded…
A:
Q: You'd like to test the null hypothesis that the means of the two samples (column A and column B) are…
A: There are two independent samples which are X1 and X2. We have to test whether the means of the two…
Q: It is generally believed that the heights of adult males in the us are approximately normally…
A: From the given information, The heights of the males is approximately normally distributed with mean…
Q: The acceptable level for insect filth in a certain food item is 5 insect fragments (larvae, eggs,…
A: Here, we know that, sample mean is unbiased estimator of population mean.
Q: Jump to level 1 A software company is interested in improving customer satisfaction rate from the…
A: Given,n=240x=188sample proportion(p^)=xnsample proportion(p^)=188240=0.7833population…
Q: State the hypotheses. Họ: H - 98.6°F H: H < 98.6°F Find the test statistic. (Round to two decimal…
A:
Q: 1. A researcher claims that the United Nationalist Alliance (UNA) will win the election. A total of…
A: Given that Sample size n =4300 Favorable cases x =2200 Sample proportion p^=x/n
Q: Given a standard normal distribution, find the area under the curve that lies: a. to the left of z =…
A: We have given that the different z-scores. Note: P-value is taken from standard normal…
Q: Suppose 40 measurements of the drying times are recorded. The sample mean and the standard deviation…
A: The random variable drying times follows normal distribution. We have to construct 95% CI for the…
Q: 1. Previous evidence show that majority of the students are happy and contented with the…
A: The evidences show that majority of the students are happy and contented with the university's…
Q: A chi-square distribution with 13 degrees of freedom is graphed below. The 0.20- 0.15- 0.10-- Area =…
A: We have given that Degree of freedom (df) = 13 The area to the right of this region is = 0.2
Q: Calculate the 95% prediction intervals for the four different investments included in the following…
A: Given that
Q: Andrea Anemone borrowed money to buy a car at 13.5% simple interest from her credit union. If the…
A: Given that rate of interest is r= 13.5% Time is t= 2 years. Amount of interest is S.I.= 27000.
Q: Consider two events A and B. Use Venn diagram to show that (AU B) \ A = B\ A
A:
Q: nds are due December 3: nnual interest rate, pay
A: It is given that brodie corporation acquired bonds with a par value of $600,000 for $628,800 on…
Q: What is the probability that 24% or fewer male employees will indicate that they have to pick up…
A: Given that n=100 , p=25%=0.25 Note: According to bartleby experts question answers guidelines an…
Q: 4, The hardness of ten steel samples was measured and the results were as follows. 1 2 8. Sample…
A:
Q: 1. Suppose X1,X2,...,Xn is a random sample of size n > 5 that comes from a distribution with E[X] =…
A: X1 , X2, .... , Xn are samples from a distribution with E(X) = µ and Var(X) = σ2 There are two…
Q: You'd like to test the null hypothesis that the means of the two samples (column A and column B) are…
A: There are two independent samples which are X1 and X2. We have to test whether the means of the two…
Q: amount of time spent at the ATM machine (SECONDS) and the gender, FEMALE (dummy variable = 1 for…
A: It is given that seconds =27.
Q: 9. The mean cost customers pay for gasoline in a gas station is SAR 75. The distrıbu cost of…
A: Formula : Z =(X - μ)/σ
Q: Cor Salon provides haircut and facial cleansing, 40% of customers are older men and 007% of…
A: Given information: P(older men)=40%=0.40 P(younger men)=60%=0.60 P(facial cleansing| older…
Q: Solve the forwards problem below. Round all z-scores to the nearest hundredth when necessary. A…
A: For the given data fill the required blanks
Q: from the given parameters of the population and sample size. and ox Determine p=81, o = 18, n= 36…
A:
Q: A sample of single persons receiving Social Security payments revealed these monthly benefits: $875,…
A:
Q: The number of pizzas consumed per month by university students is normally distributed with a mean…
A: Let X be the number of pizzas consumed per month follows normal distribution with mean 10 and…
Q: A time series dataset consists of 100 observations x,x,., x,00. The following summary statistics…
A:
Q: Population variances o and o, are known. Question: Two kinds of thread are being compared for…
A:
Q: The table summarizes results from pedestrian deaths that were caused by automobile accidents.…
A: Given information: Driver intoxicated?\Pedestrain intoxicated? Yes No Total Yes 48 68 116 No…
Q: with rejection region RR = Y > 42.8. a) What is the distribution of Y assun.ng Ho is true? b)…
A:
Q: Q/ In the vehicle speed test, the results are iven in the table below: Find - Arithmetic mean 2.…
A:
Q: 10- 8 - 6 6 - 4 2 2- 0+ 4.8 7.2 8.4 9.6 Histogram (Frequency Diagram) Frequency
A: Does the graph approximates a normal distribution?
Q: The sugar content of the syrup in canned peaches is normally distributed. A random sample of n = 10…
A: For the given data Find 95% C.I for sigma
Q: You take your family on a wonderful, relaxing vacation to the beach. About 15 minutes after you’ve…
A:
Q: A psychic calls everyone on a list of 275 sports bettors with tips about who will win the…
A:
Q: 1. X is a normally normally distributed variable with mean p = 30 and %3D standard deviation o = 4.…
A:
Q: 2. A radar unit is used to measure speeds of cars on a motorway. The speeds are normally distributed…
A: Let X be the radar unit X~N(mean μ=90, standard deviations σ=10) P(X>100)=? Note: this…
Q: A researcher were conducted in the effect of outdoor activity on mood. She hypotthesized that…
A: Given: Mode before Mode after 4 5 3 3 1 4 5 5 1 5 2 4 3 2 4 5 3 4 4 4…
Q: Solve this forwards problem by finding the area of the shaded region on the standard normal curve…
A: For the normal curve p ( 2.12 < z <1.93) = ?

Step by step
Solved in 2 steps

- Suppose that n = 50, i.i.d. observations for (Yi, Xi) yield the followingregression results: Ŷ= 49.2 + 73.9X, SER = 13.4, R2 = 0.78. (23.5) (16.4)Another researcher is interested in the same regression, but makes an errorwhen entering the data into a regression program: The researcher enterseach observation twice, ending up with 100 observations (with observation1 entered twice, observation 2 entered twice and so forth).a. Using these 100 observations, what results will be produced by theregression program? (Hint: Write the “incorrect” values of the samplemeans, variances, and covariances of Y and X as functions of the “correct”values. Use these to determine the regression statistics.) Ŷ = ____ + ____X, SER = ____, R2 = ____. (____) (____)b. Which (if any) of the internal validity conditions are violated?For x={1 2 3 4 5} and y={2 1 4 3 6} use normal equation (c =(ATA)-1ATy) to find with: a-) linear regression coefficients, b-) the linear regression equation, c-) residel sum of squares(RSS)Consider the following simple linear regression model: y = β0 + β1x + u. Using a sample of n observations on x and y, you estimate the model by OLS and obtain the estimates βˆ 0, βˆ 1, and the R-squared of the regression, R2 . Then you scale this sample by a factor of 100, obtain a new sample {xi/100; yi/100} for i = 1, . . . , n, re-estimate the model by OLS, and denote the new coefficient estimates by β˜ 0, β˜ 1, and the new R-squared of the regression by R˜2 . a) Give the expression of β˜ 1 in terms of βˆ 1, and justify your answer.
- For b there are two cases and for c I have to plug the initial data into the odeSuppose we consider the following model: Xt2 = b0 + b1X2t-1 + ut The estimation of the model provided the following: Xt2 = 0.00043 + 0.23036X2t-1 t = (7.71) (4.97) R2 = 0.0531 d = 1.9933 where Xt2 is as defined before. Given a p value for b1 of .0001 what do conclude about the significance of the model?Use Least Square Regression to fit y=ax^b to the given below.
- A forecaster used the regression equation Qt = a + bt + c1D1 + c2D2 + c3D3 and quarterly sales data for 2004I–2021IV (t = 1, ..., 64) for an appliance manufacturer to obtain the results shown below. Q is quarterly sales, and D1, D2 and D3 are dummy variables for quarters I, II, and III. DEPENDENT VARIABLE: QT R-SQUARE F-RATIO P-VALUE ON F OBSERVATIONS: 64 0.8768 107.982 0.0001 VARIABLE PARAMETER ESTIMATE STANDARD ERROR T-RATIO P-VALUE INTERCEPT 30.0 12.80 2.34 0.0224 T 1.5 0.70 2.14 0.0362 D1 10.0 3.00 3.33 0.0015 D2 25.0 7.20 3.47 0.0010 D3 40.0 15.80 2.53 0.0140 What is the estimated intercept of the trend line in the second quarter?The following estimated regression equation based on 10 observations was presented. ŷ = 29.1670 + 0.5902x1 + 0.4960x2 Here, SST = 6,734.125, SSR = 6,212.375, sb1 = 0.0816, and sb2 = 0.0569. (a) Compute MSR and MSE. (Round your answers to three decimal places.) MSR=?? MSE=?? (b) Compute F and perform the appropriate F test. Use ? = 0.05. State the null and alternative hypotheses. H0: ?1 = ?2 = 0 Ha: One or more of the parameters is not equal to zero. H0: ?1 > ?2 Ha: ?1 ≤ ?2 H0: ?1 ≠ 0 and ?2 ≠ 0 Ha: One or more of the parameters is equal to zero. H0: ?1 < ?2 Ha: ?1 ≥ ?2 H0: ?1 ≠ 0 and ?2 = 0 Ha: ?1 = 0 and ?2 ≠ 0 Find the value of the test statistic. (Round your answer to two decimal places.) F = ?? Find the p-value. (Round your answer to three decimal places.) p-value = ?? State your conclusion. -Reject H0. There is sufficient evidence to conclude that the overall model is significant. -Do not reject H0.…. From the Exerrise 6.2(1). find the regression line using the least squares 11 lerhod . Interpret the result. Then. estimate the ntunber of hours he or she exercises per \\"week \vhen his or her age is 50 years old. Exercise 6.2(1). Age. x 18 26 32 38 52 59 Hours. y 10 5 -1 3 1. 5 1
- A forecaster used the regression equation Qt = a + bt + c1D1 + c2D2 + c3D3 and quarterly sales data for 2004I–2021IV (t = 1, ..., 64) for an appliance manufacturer to obtain the results shown below. Q is quarterly sales, and D1, D2 andD3 are dummy variables for quarters I, II, and III. DEPENDENT VARIABLE: QT R-SQUARE F-RATIO P-VALUE ON F OBSERVATIONS: 64 0.8768 107.982 0.0001 VARIABLE PARAMETER ESTIMATE STANDARD ERROR T-RATIO P-VALUE INTERCEPT 30.0 12.80 2.34 0.0224 T 1.5 0.70 2.14 0.0362 D1 10.0 3.00 3.33 0.0015 D2 25.0 7.20 3.47 0.0010 D3 40.0 15.80 2.53 0.0140 Using the estimation results given above, the predicted level of sales in 2022II is _______ units.23. Compute the actual values indicated by A,B,C and D in that order. A. 2569, 560, 996553, 87103 B. 996553, 2569, 87103, 560 C. 650, 632699, 18730, 9562 D. 2695, 650, 633599, 17830 24. If the general linear regression model is given by the equation: y=a+bx; considering the information obtained in figure 2, compute the value of b. A. 210.185 B. 121.852 C. 21.850 D. 2.185 25. If the general linear regression model is given by the equation: y=a+bx; considering the information obtained in figure 2, compute the value of a. A. 397.210 B. 973.102 C. 210. 379 D. 237.021In an instrumental variable regression model with one regressor, Xi, andone instrument, Zi, the regression of Xi onto Zi has R2 = 0.1 and n = 50.Is Zi a strong instrument? Would your answer change if R2 = 0.1 and n = 150?
