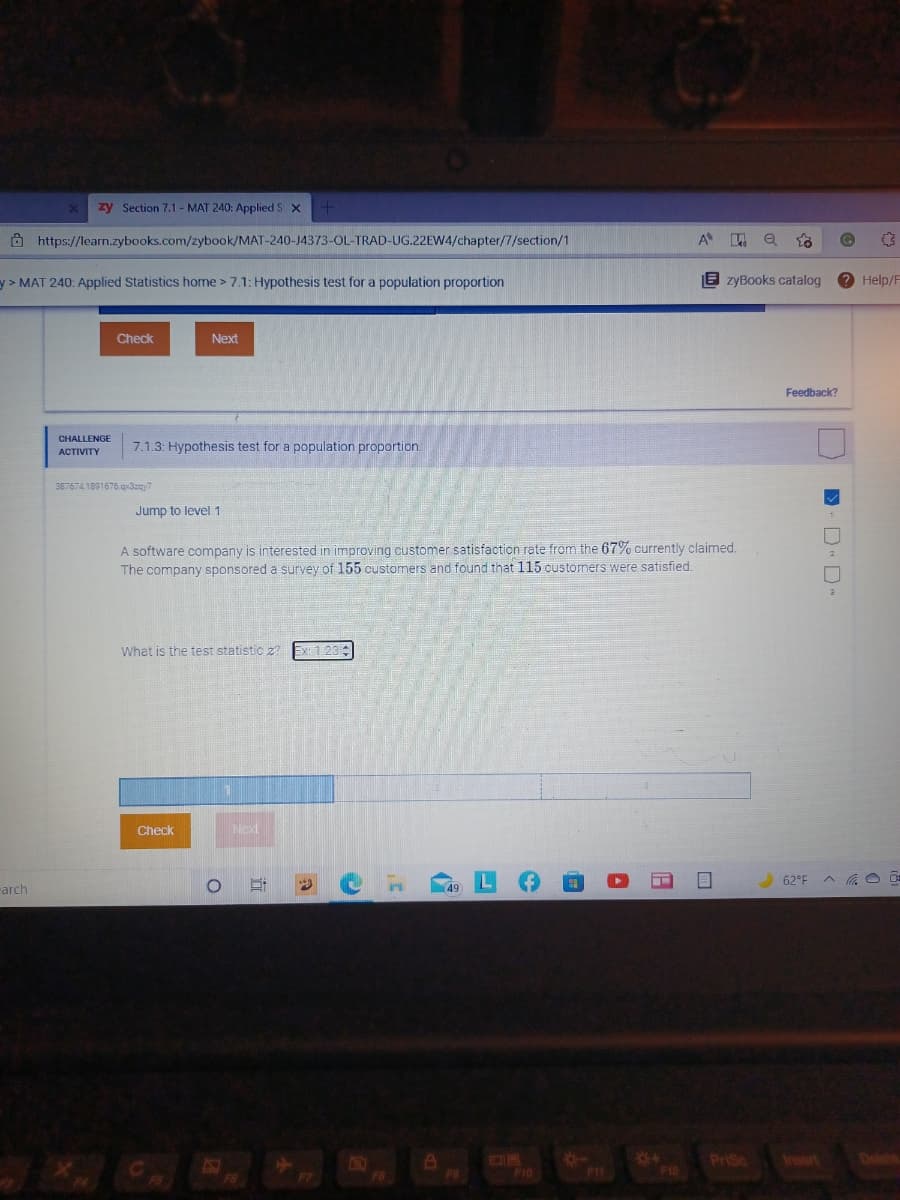
Jump to level 1 A software company is interested in improving customer satisfaction rate from the 67% currently claimed. The company sponsored a survey of 155 customers and found that 115 oustomers were satisfied. What is the test statistic z? Ex 123


Q: A bakery shops sells an average of 105 cakes per week (i) Find the probability that on a given day…
A: here AS PER GUIDELINES I HAVE CALCULATED FIRST MAIN QUESTION ONLY HERE given, a bakery shops…
Q: their advertisements, a new diet program would like to claim that their methods result in a mean…
A: Given that Sample size n =25 Population mean μ =10
Q: Online courses: A sample of 260 students who were taking online courses were asked to describe their…
A: Given: Sample size(n) = 260 Sample mean x¯ =5.41 Sample standard deviation (s) = 0.89 Confidence…
Q: You're a sociologist studying whether grocery prices are different in the inner cities than they are…
A: Null hypothesis: H0:The average inner city prices are equal to suburban average prices. Alternative…
Q: The following three independent random samples are obtained from three normally distributed…
A: There are 3 independent samples which are Internship, Co-op and Work Study. We have to test whether…
Q: PLEASE make sure that your answer is right. You are a Quality Control Engineer. You sample 4…
A: n=sample size=4, sample mean x̄=230 Population standard deviations σ=5
Q: y the validation pa
A: The validation dataset is not the same as the test dataset that is likewise kept away from the…
Q: size n, where n is sufficiently large is drawn from any population with mean ? and standard…
A: Note: As per answering guidelines I have to answer only one question at a time. But i have solved…
Q: Use the t-distribution to find a confidence interval for a difference in means estimate for a…
A:
Q: The next 10 questions refer to the following scenario. The average student studies eight hours for a…
A: Given that Sample size n =25 Sample mean =87 Population mean μ =84
Q: Practice with the t distribution. An independent random sample is selected from an ap- proximately…
A: Given the formula for confidence interval of t distribution. We have to find the critical value C…
Q: how to evaluate the distributions of the BFI-10 Extraversion Scale, the BFI-10 Neuroticism Scale,…
A: Given information: The objective is to evaluate the distribution of some variables.
Q: In a sample ofn = 20, the correlation between two variables is r = 0.7. Determine if this…
A: The independent variable is x. The dependent variable is y. We have to find the test statistic and…
Q: What correlation method should be used in the following situations:
A: The choice of associational statistic is dependent on two parameters.
Q: B. Determine the inflation rate of Country ABC using its CPI from 2020 and 2021. Price Price Price…
A:
Q: To determine if people prefer this year's school start time over last year's school start time, WCS…
A: From the above data
Q: In the population of students at Milpitas High School, the proportion who are in the marching band…
A: We have given, p = 0.10 = population proportion n =100 = sample size Phat = 0.04 = sample proportion…
Q: You're a data analyst for an insurance company. You want to make sure that your employer is not…
A: There are two independent samples which are Bubba and Merle. We have to test whether prices are…
Q: An important issue in assessing nuclear energy is whether excess disease risks exist in the…
A: Please find the explanation below. Thank you
Q: Sample proportion: 62.29% Sample size: 7,280,980 Send individual texts & have 4 people gue standard…
A: Sample Proportion (p) 0.6229 Sample Size 7280980 (1-p) 0.3771 4 people guess the standard…
Q: Use the lattice multiplication shown to answer parts a and b. 6. 2. a. Determine the numbers being…
A:
Q: You may need to use the appropriate appendix table or technology to answer this question. Given are…
A: Hi! Thank you for the question, as per the honor code, we are allowed to answer three sub-parts at a…
Q: Find the percentile rank of a test score of 76 for the data set 70,73,68,83,78,80,89,88,65
A: Solution-: Given data: 70,73,68,83,78,80,89,88,65 We find percentile rank of a test score of 76=?
Q: Describe how you can make the line of best fit. Write the approximate slope and Y intercept of the…
A: Describe how you can make the line of best fit. Write the approximate slope and Y intercept of the…
Q: Consider the following time series data: Month 1 2 3 4 5 6 7 Value 25 13 19 11 19 23 16 (a) Compute…
A: Formula for mean square error of the data set is given by MSE=∑Absolute error2N-1 Here,…
Q: A sample of single persons receiving Social Security payments revealed these monthly benefits: $875,…
A:
Q: 35 12 15 19 26 318
A: Given the data as Outdoor Activity Mood 410 35 375 30 155 12 95 15 175 19 210 26…
Q: find the p-value based on a standard normal distribution for the standrized test statistic and…
A: Given information: z=-1.86 Ha:p<0.5 From the alternative hypothesis, the tail of the test is less…
Q: Assume the sample standard deviation is s=10, what do you conclude? You fail to reject the null You…
A: Given that Sample size n =25 Sample mean =87 Population mean =84 Standard deviation s=10
Q: Determine the sample mean and sample standard deviation based on the confidence interval for the…
A: a) The sample mean is, The value of margin of error is, The degree of freedom is, df=n-1 =13-1…
Q: A small-business Web site contains 100 pages and 60%, 30%, and 10% of the pages contain low,…
A: From the given information, A small-business Web site contains 100 pages and 60%, 30%, and 10% of…
Q: What's the probability that bad credit customer does not receive a loan (sensitivity ot power of a…
A:
Q: Assume a student received the following grades for the semester: History. B: Statistics, A: Spanish,…
A: The given that the student received B grade for history , A grade for statistics , C grade for…
Q: Consider the following. Sample A Sample B s2 30 32 n 25 20 We want to test the hypothesis that…
A: According to the given information in this question we need to calculate the test statistic We know…
Q: Use the t-distribution to find a confidence interval for a difference in means -given the relevant…
A:
Q: Lifetime of electronics: In a simple random sample of 100 electronic components produced by a…
A: Given information: sample size, n=100sample mean, x¯=125σ=20 Confidence level is 80%. Significance…
Q: A raft is floating on the ocean. Its distance compared to the height of the dock is recorded over…
A:
Q: You're a sociologist studying whether grocery prices are different in the inner cities than they are…
A: Null hypothesis: H0:The average inner city prices are equal to suburban average prices. Alternative…
Q: police radar unit measured the speed of 25 cars on Elm Street. The resulting speeds were: 29, 23,…
A: Given that The data are 29, 23, 30, 30, 27, 24, 30, 25, 23, 28, 25, 24, 28, 30, 23, 30, 27, 25, 29,…
Q: MAKE SURE YOU SELECT 2 ANSWERS FOR THIS QUESTION - Type of test and hypothesis. Professor Ratzo…
A: Given : Number of rats gets buttered bread = 10 Number of rats cheddar cheese bread = 10 Number of…
Q: Maria frequently travels on business between major cites. She always fes on Marshal Airways because…
A: Solution: Given information: μ= 228 Population Mean Claim: The average flight time for the trip is…
Q: Select all correct statements regarding the following McLeod-Li test chart. 10 15 20 25 Lag There…
A:
Q: A random sample of 16 Porsche drivers yielded an average age of 50 years with a variance of 9 years…
A: Solution: Given information: Porsche Driver n1= 16x1= 50s12 = 9 Ferrari Driver n2= 16x2 = 47s22= 25…
Q: The target temperature for a hot beverage the moment it is dispensed from a 190 vending machine is…
A: Given μ=150 σ=3.3 n=25 x¯=151
Q: A cannabis business operates as follows. Let X, be the amount of cannabis in its inventory on the…
A:
Q: A new software package is expected to improve productivity at Suretown Insurance. However, because…
A: Given Annual expected saving $10000 Find Compute values of these for+/-15% and 7.5% of the base case
Q: Question 4: Playing LOTO The St. Lucia National Lottery has many games designed to raise funds for…
A: A number of events are said to be independent if the probability of occurrence of any one of them is…
Q: 11. A recent study of smoking cessation programs collected information about nicotine replacement…
A: Data: Total no. of people = 86+661+60+40+106+172+102+239 = 1466 P(patch) = (60+40+106+661)/ 1466…
Q: The first case has a value for Y that is missing. Which of the following values would you choose to…
A:
Q: 2. A radar unit is used to measure speeds of cars on a motorway. The speeds are normally distributed…
A: Given μ=90 km/hrσ=10 km/hr Find The probability that a car picked at random is travelling at more…


Trending now
This is a popular solution!

Step by step
Solved in 3 steps

- Determine the kurtosis if the data given is a sample.A test of body reaction to the Malaysian citizens who have taken their vaccine was conducted. Selected citizens who got side effect are categorised according to their blood type and the type of vaccine received. From a sample of 250 citizens, 150 of them were administered withSinovac while the rest received AstraZeneca. Table 4 shows the number of citizens who had side effect after being vaccinated. (Question & Table at images)The Canine Gourmet Company produces delicious dog treats for canines with discriminating tastes. Management wants the box-filling line to be set so that the process average weight per packet is 42 grams. To make sure that the process is in control, an inspector at the end of the filling line periodically selects a random box of 8 packets and weighs each packet. When the process is in control, the range in the weight of each sample has averaged 6 grams. a. Design an R- and an x-chart for this process.
- The authors of the paper "Dynamics of Canopy Structure and Light Interception in Pinus elliottii, North Florida" (Ecological Monographs (1991):33-51) planned an experiment to determine the effect of fertilizer on a measure of leaf area. A number of plots were available for the study, and half were selected at random to be fertilized. In order to assure that the plots to receive the fertilizer and the control plots were similar, prior to beginning the experiment tree density (the number of trees per hectare) was recorded for six plots to be fertilized and six control plots, resulting in the given data. Do the plots differ in tree number? Do you have any concerns about their experimental design? Fertilizer plots 1320 1216 1312 1280 1216 1312 control plots 1104 1072 1088 1150 1272 1280The average drying time of a manufacturer’s paint is 20 minutes. Investigating the effectiveness of a modifica-tion in the chemical composition of her paint, the manu-facturer wants to test the null hypothesis μ = 20 minutes against a suitable alternative, where μ is the average dry-ing time of the modified paint. (a) What alternative hypothesis should the manufactureruse if she does not want to make the modification in thechemical composition of the paint unless it decreases thedrying time?(b) What alternative hypothesis should the manufactureruse if the new process is actually cheaper and she wants tomake the modification unless it increases the drying timeof the paint?Because the t value you found is _______ , you decide to ________ the null hypothesis. (Note that this conclusion is also supported by the significance reported by SPSS.) Group of answer choices in the critical region, reject in the critical region, accept NOT in the critical region, accept NOT in the critical region, reject
- Suppose we want to predict job performance of Chevy mechanics based on mechanical aptitude test scores. Job Performance Mechanical Aptitude 1 40 2 45 1 38 3 50 2 48 3 55 3 53 4 55 4 58 3 40 5 55 3 48 3 45 2 55 4 60 5 60 5 60 5 65 4 50 3 58 6 60 3 45 Test at 0.05 level of significance. Assuming data is normal. Use 2 decimal places. Pick one method to be used: Chi-Square Test Mann Whitney U Test Spearman Rank and Friedman Test Mc Nemar’s Test for Correlated Proportions Kendall’s Coefficient of Concordance W Kolmogorov-Smirnov Test Multiple Regression After picking one method to be used, answer the following: What test method to be used: R: Coefficient of Determination: Slope of the line: Y intercept:An urban community wants to show that the incidence of breast cancer is higher in their locality than in a neighboring rural area. (PCB levels were found to be higher in the soil of the urban community). If you find that in the urban community 20 out of 200 adult women have breast cancer and that in the rural community 10 out of 150 adult women have it, could you conclude, at a significance level of 0.05, that breast cancer is more prevalent in the urban community?1. The parameter of interest is:2. The hypotheses for this test are:3. The calculated test statistic is:4. The critical region is:5. Draw the critical region (make decision):6. It can be concluded that:Applying the Concepts and SkillsIn Exercises, perform a Kruskal–Wallis test by using either the critical-value approach or the P-value approach.Spider Mites. The reproduction capability of spider mites infected with a bacteria called Cardinium was studied in the article “Cardinium Symbionts Cause Cytoplasmic Incompatibility in Spider Mites” (Heredity, Vol. 98, No. 1, pp. 13–20) by T. Gotoh et al. Infected mites were crossed with mites treated with antibiotics. The following table shows the number of eggs per female for each combination tested. Here we use “A” for antibiotic-treated, “I” for infected, “M” for male, and “F” for female. IF&IM IF&IM AF&IM AF&AM 18 26 11 19 19 21 18 22 22 19 22 16 19 19 17 20 22 20 13 18 18 17 19 19 25 17 5 17 22 14 At the 10% significance level, do the data provide sufficient evidence to conclude that a difference exists in mean number of eggs among the four combinations?
- Omega-3, finis Exercises 21 and 23 describe an experi-ment investigating the effectiveness of omega-3 fats in treating bipolar disorder. Suppose some of the 30 sub-jects were very active people who walked a lot or got vig-orous exercise several times a week, while others tended to be more sedentary, working office jobs and watchinga lot of TV. Why might researchers choose to block thesubjects by activity level before randomly assigning themto the omega-3 and placebo groups?The shape of the mean-variance frontier that results from the combination of a riskless and arisky asset is…..:a. Is U-shaped, tilted 90 degrees clockwise.b. Is a straight line passing from the mean-variance points of the two assets.c. Is a hyperbola.d. Consists of two straight lines, each connecting one of the two assets to a risk-freeportfolioA local chess club claims that the length of time to play a game has a mean of 43 minutes or more. Write sentences describing type I and type II errors for a hypothesis test of this claim. A type I error will occur if the actual mean of the length of time to play a game is ▼ equal to less than or equal to not equal to greater than or equal to greater than less than 43 minutes, but you ▼ reject fail to reject the null hypothesis, ▼ Upper H 0 : mu greater than or equals 43H0: μ≥43 Upper H 0 : mu not equals 43H0: μ≠43 Upper H 0 : mu equals 43H0: μ=43 Upper H 0 : mu less than or equals 43H0: μ≤43 Upper H 0 : mu greater than 43H0: μ>43 Upper H 0 : mu less than 43H0: μ<43 . A type II error will occur if the actual mean of the length of time to play a game is ▼ greater than less than or equal to less than greater than or equal to equal to not equal to 43 minutes, but you ▼ fail to reject reject the null hypothesis, ▼ Upper H 0…

