The number of pizzas consumed per month by university students is normally distributed with a mean of 10 and a standard deviation of 3. a. What proportion of students consume more than 12 pizzas per month?
The number of pizzas consumed per month by university students is normally distributed with a mean of 10 and a standard deviation of 3. a. What proportion of students consume more than 12 pizzas per month?

Glencoe Algebra 1, Student Edition, 9780079039897, 0079039898, 2018
18th Edition
ISBN:9780079039897
Author:Carter
Publisher:Carter
Chapter10: Statistics
Section10.4: Distributions Of Data
Problem 19PFA

Related questions
Question
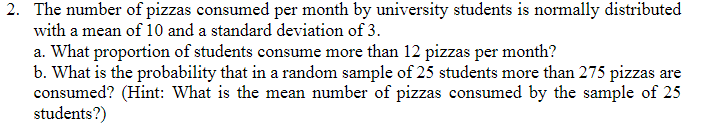
Transcribed Image Text:2. The number of pizzas consumed per month by university students is normally distributed
with a mean of 10 and a standard deviation of 3.
a. What proportion of students consume more than 12 pizzas per month?
b. What is the probability that in a random sample of 25 students more than 275 pizzas are
consumed? (Hint: What is the mean number of pizzas consumed by the sample of 25
students?)
Expert Solution
This question has been solved!
Explore an expertly crafted, step-by-step solution for a thorough understanding of key concepts.

This is a popular solution!

Trending now
This is a popular solution!

Step by step
Solved in 2 steps

Recommended textbooks for you
Glencoe Algebra 1, Student Edition, 9780079039897…
Algebra
ISBN:
9780079039897
Author:
Carter
Publisher:
McGraw Hill
Glencoe Algebra 1, Student Edition, 9780079039897…
Algebra
ISBN:
9780079039897
Author:
Carter
Publisher:
McGraw Hill