N= 150 observations were collected on a time series that was identified as a AR(2) time series. The following statistics were computed from the data. Mean - 45.0 Variance 15.6 Autocorrelation function (up to lag 5) r1 = 0.80, r2 = .50, rз = .26, r4 = -.10, rs = 0.08: == Estimate the parameters of the model using the method of moments.
N= 150 observations were collected on a time series that was identified as a AR(2) time series. The following statistics were computed from the data. Mean - 45.0 Variance 15.6 Autocorrelation function (up to lag 5) r1 = 0.80, r2 = .50, rз = .26, r4 = -.10, rs = 0.08: == Estimate the parameters of the model using the method of moments.

MATLAB: An Introduction with Applications
6th Edition
ISBN:9781119256830
Author:Amos Gilat
Publisher:Amos Gilat
Chapter1: Starting With Matlab
Section: Chapter Questions
Problem 1P

Related questions
Question
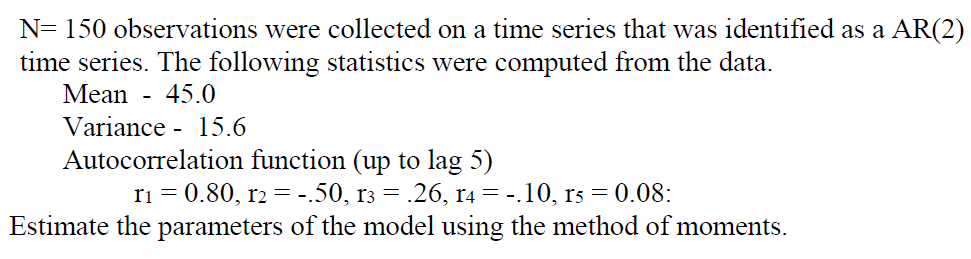
Transcribed Image Text:N= 150 observations were collected on a time series that was identified as a AR(2)
time series. The following statistics were computed from the data.
Mean - 45.0
Variance 15.6
Autocorrelation function (up to lag 5)
r1 = 0.80, r2 = .50, rз = .26, r4 = -.10, rs = 0.08:
==
Estimate the parameters of the model using the method of moments.
Expert Solution
This question has been solved!
Explore an expertly crafted, step-by-step solution for a thorough understanding of key concepts.

Step by step
Solved in 1 steps

Recommended textbooks for you
MATLAB: An Introduction with Applications
Statistics
ISBN:
9781119256830
Author:
Amos Gilat
Publisher:
John Wiley & Sons Inc

Probability and Statistics for Engineering and th…
Statistics
ISBN:
9781305251809
Author:
Jay L. Devore
Publisher:
Cengage Learning

Statistics for The Behavioral Sciences (MindTap C…
Statistics
ISBN:
9781305504912
Author:
Frederick J Gravetter, Larry B. Wallnau
Publisher:
Cengage Learning
MATLAB: An Introduction with Applications
Statistics
ISBN:
9781119256830
Author:
Amos Gilat
Publisher:
John Wiley & Sons Inc
Probability and Statistics for Engineering and th…
Statistics
ISBN:
9781305251809
Author:
Jay L. Devore
Publisher:
Cengage Learning
Statistics for The Behavioral Sciences (MindTap C…
Statistics
ISBN:
9781305504912
Author:
Frederick J Gravetter, Larry B. Wallnau
Publisher:
Cengage Learning

Elementary Statistics: Picturing the World (7th E…
Statistics
ISBN:
9780134683416
Author:
Ron Larson, Betsy Farber
Publisher:
PEARSON

The Basic Practice of Statistics
Statistics
ISBN:
9781319042578
Author:
David S. Moore, William I. Notz, Michael A. Fligner
Publisher:
W. H. Freeman

Introduction to the Practice of Statistics
Statistics
ISBN:
9781319013387
Author:
David S. Moore, George P. McCabe, Bruce A. Craig
Publisher:
W. H. Freeman