na standard Normal model, what value(s) of z cut(s) off the region described? Don't forget to draw a picture. a) the highest 20% p) the highest 60% c) the lowest 70% d) the middle 90% a) Choose the correct graph of the highest 20%. O A. O B. OC. OD. 20% 20% 20% 20%
na standard Normal model, what value(s) of z cut(s) off the region described? Don't forget to draw a picture. a) the highest 20% p) the highest 60% c) the lowest 70% d) the middle 90% a) Choose the correct graph of the highest 20%. O A. O B. OC. OD. 20% 20% 20% 20%

Glencoe Algebra 1, Student Edition, 9780079039897, 0079039898, 2018
18th Edition
ISBN:9780079039897
Author:Carter
Publisher:Carter
Chapter10: Statistics
Section10.4: Distributions Of Data
Problem 20PFA

Related questions
Question
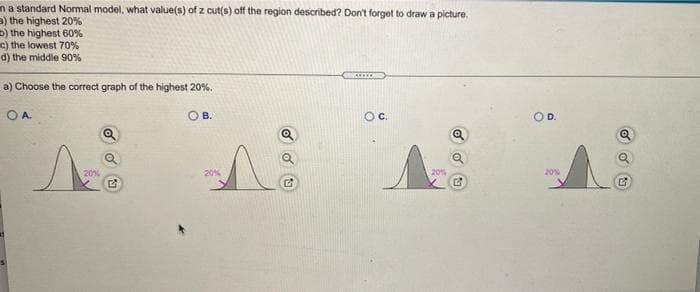
Transcribed Image Text:na standard Normal model, what value(s) of z cut(s) off the region described? Don't forget to draw a picture.
a) the highest 20%
D) the highest 60%
c) the lowest 70%
d) the middle 90%
a) Choose the correct graph of the highest 20%.
O A.
O B.
OC.
OD.
20%
20%
20%
20%
Expert Solution
This question has been solved!
Explore an expertly crafted, step-by-step solution for a thorough understanding of key concepts.

This is a popular solution!

Trending now
This is a popular solution!

Step by step
Solved in 2 steps with 2 images

Recommended textbooks for you
Glencoe Algebra 1, Student Edition, 9780079039897…
Algebra
ISBN:
9780079039897
Author:
Carter
Publisher:
McGraw Hill

Mathematics For Machine Technology
Advanced Math
ISBN:
9781337798310
Author:
Peterson, John.
Publisher:
Cengage Learning,
Glencoe Algebra 1, Student Edition, 9780079039897…
Algebra
ISBN:
9780079039897
Author:
Carter
Publisher:
McGraw Hill
Mathematics For Machine Technology
Advanced Math
ISBN:
9781337798310
Author:
Peterson, John.
Publisher:
Cengage Learning,