1 what could you tell the chain's manager based on your ANOVA results in everyday language? 2 compute scheffe's F for the comparison between denver and minneapolis 3. what is the most appropriate and complete conclusion you can draw from this result? a. the mean expenditure for denver and minneapolis is the same b the mean expenditure for denver is significantly higher than the one in minneapolis c. the mean expenditure for denver is significantly lower than the one in minneapolis d. the mean expenditure for denver and minneapolis is the different
1 what could you tell the chain's manager based on your ANOVA results in everyday language? 2 compute scheffe's F for the comparison between denver and minneapolis 3. what is the most appropriate and complete conclusion you can draw from this result? a. the mean expenditure for denver and minneapolis is the same b the mean expenditure for denver is significantly higher than the one in minneapolis c. the mean expenditure for denver is significantly lower than the one in minneapolis d. the mean expenditure for denver and minneapolis is the different

Holt Mcdougal Larson Pre-algebra: Student Edition 2012
1st Edition
ISBN:9780547587776
Author:HOLT MCDOUGAL
Publisher:HOLT MCDOUGAL
Chapter11: Data Analysis And Probability
Section11.9: Independent And Dependent Events
Problem 2E

Related questions
Question
1 what could you tell the chain's manager based on your ANOVA results in everyday language?
2 compute scheffe's F for the comparison between denver and minneapolis
3. what is the most appropriate and complete conclusion you can draw from this result?
a. the mean expenditure for denver and minneapolis is the same
b the mean expenditure for denver is significantly higher than the one in minneapolis
c. the mean expenditure for denver is significantly lower than the one in minneapolis
d. the mean expenditure for denver and minneapolis is the different
Transcribed Image Text:B
9
0
1
22
23
24
25
26
27
28
29
30
31
32
33
34
35
36
37
38
39
40
41
42
43
44
45
46
47
48
49
50
51
A
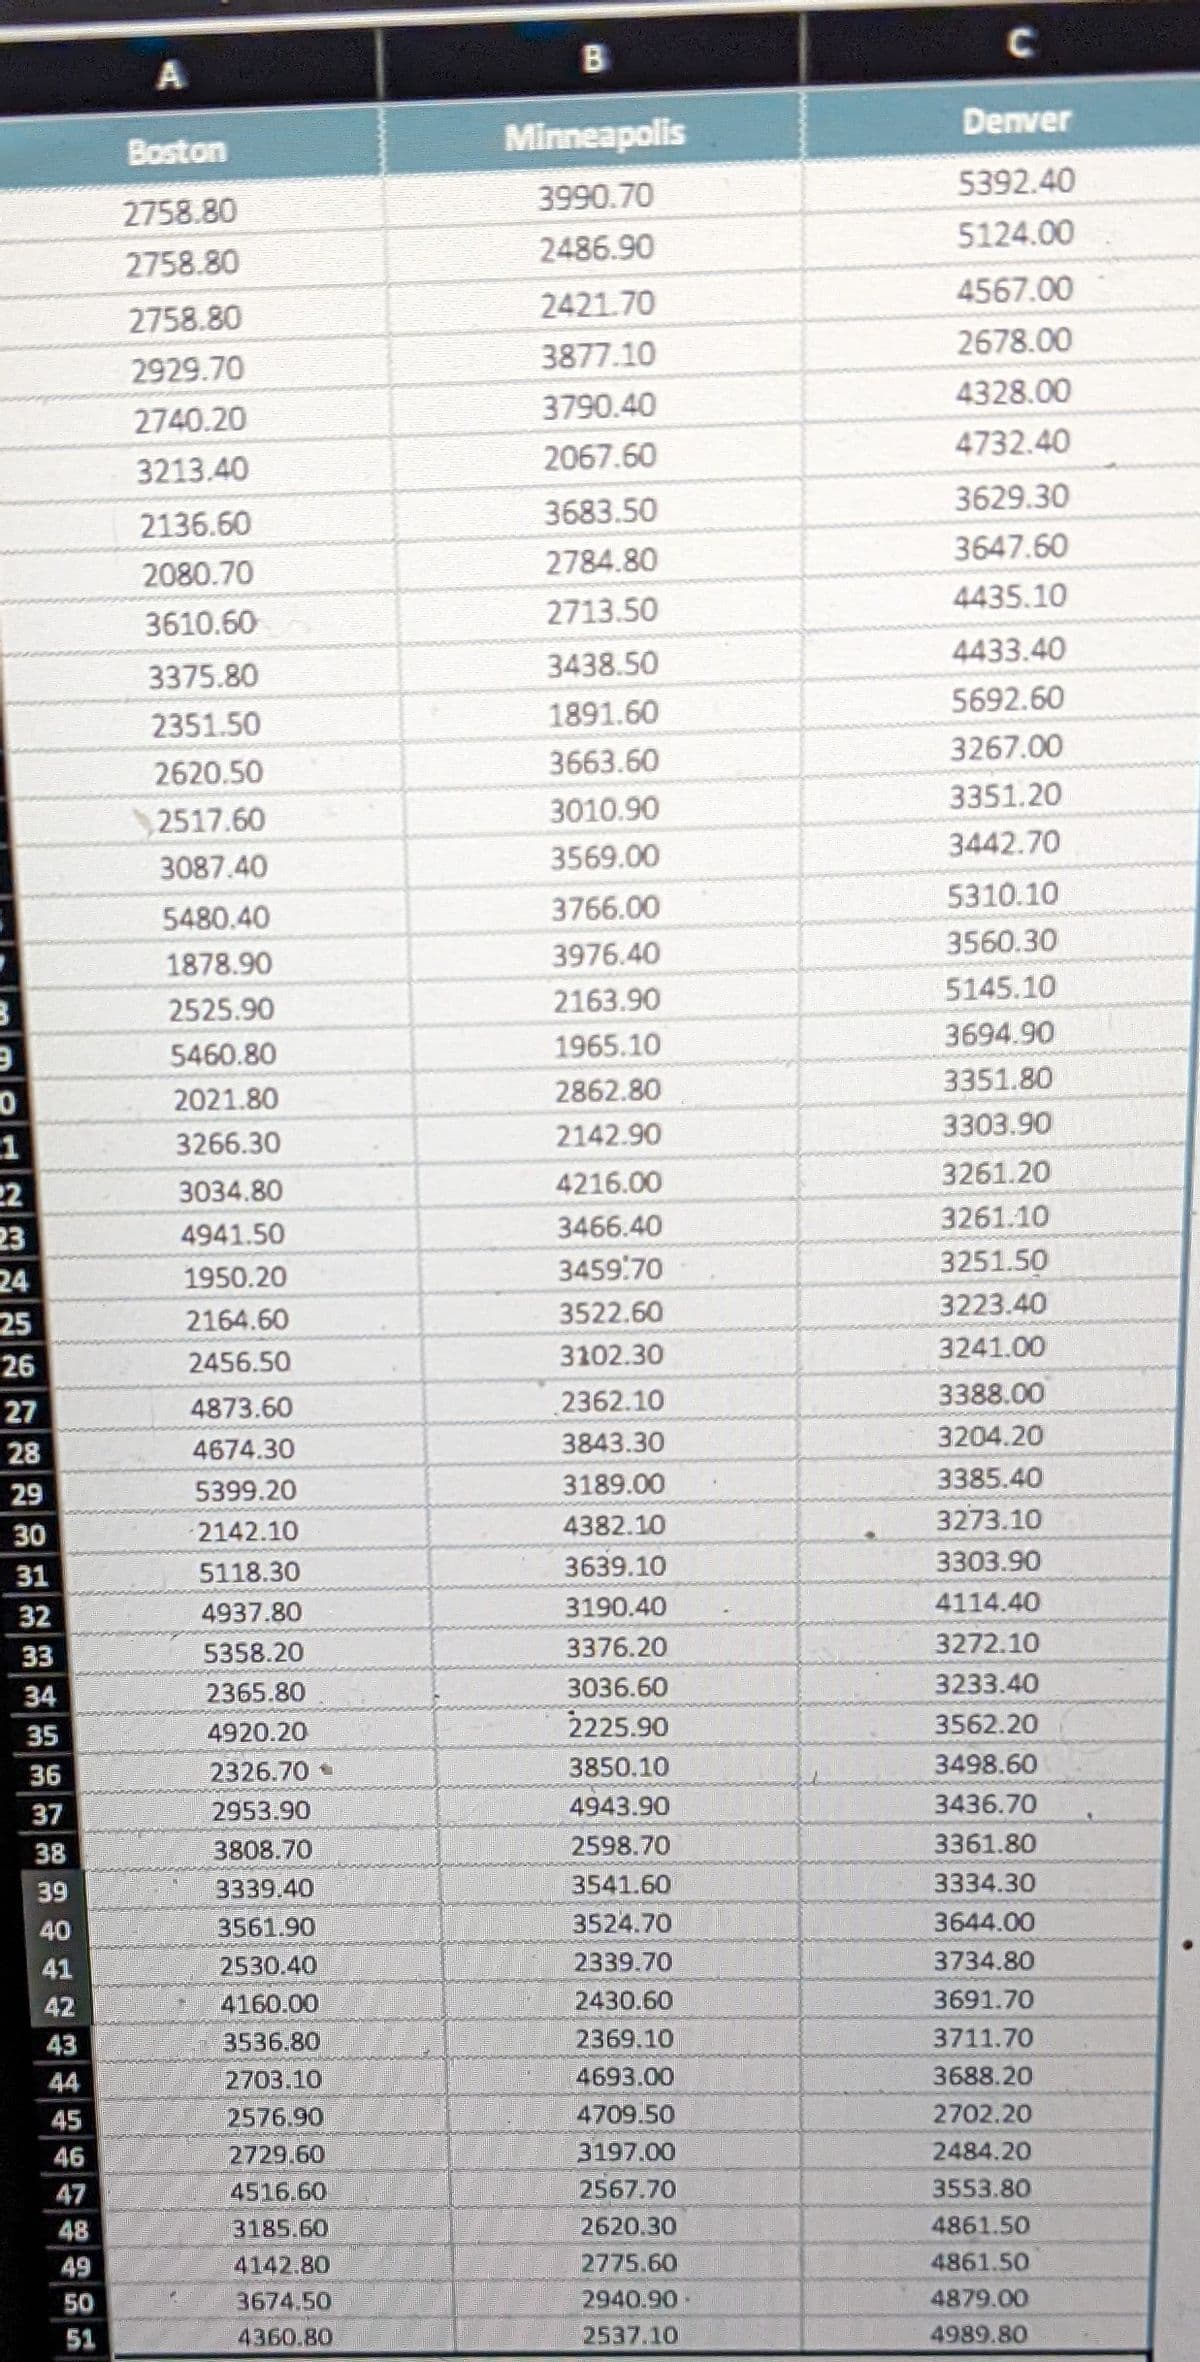
Boston
2758.80
2758.80
2758.80
2929.70
2740.20
3213.40
2136.60
2080.70
3610.60
3375.80
2351.50
2620.50
2517.60
3087.40
5480.40
1878.90
2525.90
5460.80
2021.80
3266.30
3034.80
4941.50
1950.20
2164.60
2456.50
4873.60
4674.30
5399.20
2142.10
5118.30
4937.80
5358.20
2365.80
4920.20
2326.70
2953.90
3808.70
3339.40
3561.90
2530.40
4160.00
3536.80
2703.10
2576.90
2729.60
4516.60
3185.60
4142.80
3674.50
4360.80
B
Minneapolis
3990.70
2486.90
2421.70
3877.10
3790.40
2067.60
3683.50
2784.80
2713.50
3438.50
1891.60
3663.60
3010.90
3569.00
3766.00
3976.40
2163.90
1965.10
2862.80
2142.90
4216.00
3466.40
3459:70
3522.60
3102.30
2362.10
3843.30
3189.00
4382.10
3639.10
3190.40
3376.20
3036.60
2225.90
3850.10
4943.90
2598.70
3541.60
3524.70
2339.70
2430.60
2369.10
4693.00
4709.50
3197.00
2567.70
2620.30
2775.60
2940.90-
2537.10
C
Denver
5392.40
5124.00
4567.00
2678.00
4328.00
4732.40
3629.30
3647.60
4435.10
4433.40
5692.60
3267.00
3351.20
3442.70
5310.10
3560.30
5145.10
3694.90
3351.80
3303.90
3261.20
3261.10
3251.50
3223.40
3241.00
3388.00
3204.20
3385.40
3273.10
3303.90
4114.40
3272.10
3233.40
3562.20
3498.60
3436.70
3361.80
3334.30
3644.00
3734.80
3691.70
3711.70
3688.20
2702.20
2484.20
3553.80
4861.50
4861.50
4879.00
4989.80
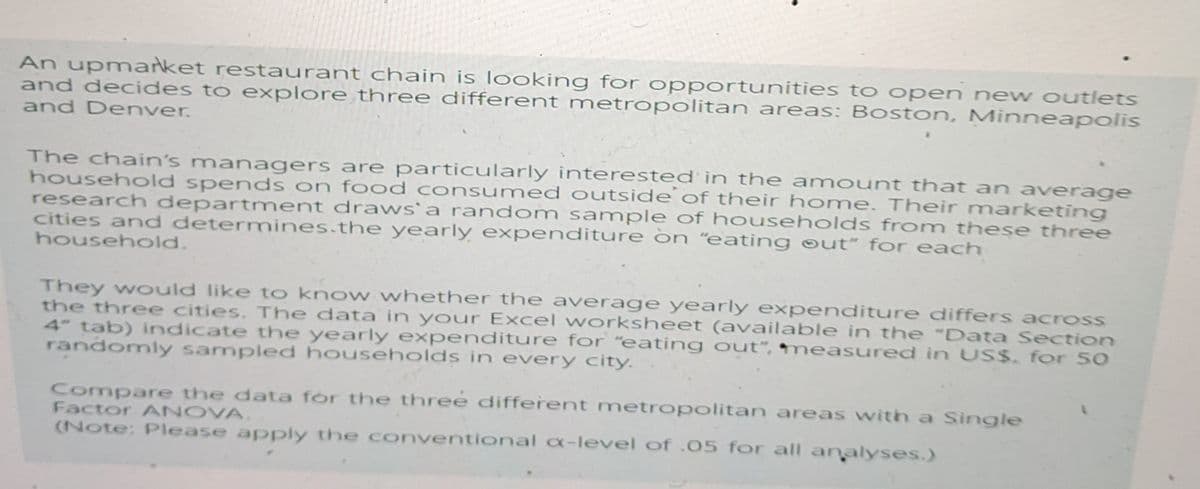
Transcribed Image Text:An upmarket restaurant chain is looking for opportunities to open new outlets
and decides to explore three different metropolitan areas: Boston, Minneapolis
and Denver.
The chain's managers are particularly interested in the amount that an average
household spends on food consumed outside of their home. Their marketing
research department draws' a random sample of households from these three
cities and determines.the yearly expenditure on "eating out" for each
household.
They would like to know whether the average yearly expenditure differs across
the three cities. The data in your Excel worksheet (available in the "Data Section
4" tab) indicate the yearly expenditure for "eating out", measured in US$. for 50
randomly sampled households in every city.
Compare the data for the three different metropolitan areas with a Single
Factor ANOVA.
(Note: Please apply the conventional x-level of .05 for all analyses.)
Expert Solution
This question has been solved!
Explore an expertly crafted, step-by-step solution for a thorough understanding of key concepts.

Step by step
Solved in 3 steps with 2 images

Follow-up Questions
Read through expert solutions to related follow-up questions below.
Follow-up Question
i am unable to identify the answer for number 2 (computing the scheffe's F between denver and minneapolis)
Solution
Recommended textbooks for you
Holt Mcdougal Larson Pre-algebra: Student Edition…
Algebra
ISBN:
9780547587776
Author:
HOLT MCDOUGAL
Publisher:
HOLT MCDOUGAL

Algebra & Trigonometry with Analytic Geometry
Algebra
ISBN:
9781133382119
Author:
Swokowski
Publisher:
Cengage

College Algebra (MindTap Course List)
Algebra
ISBN:
9781305652231
Author:
R. David Gustafson, Jeff Hughes
Publisher:
Cengage Learning
Holt Mcdougal Larson Pre-algebra: Student Edition…
Algebra
ISBN:
9780547587776
Author:
HOLT MCDOUGAL
Publisher:
HOLT MCDOUGAL
Algebra & Trigonometry with Analytic Geometry
Algebra
ISBN:
9781133382119
Author:
Swokowski
Publisher:
Cengage
College Algebra (MindTap Course List)
Algebra
ISBN:
9781305652231
Author:
R. David Gustafson, Jeff Hughes
Publisher:
Cengage Learning

Glencoe Algebra 1, Student Edition, 9780079039897…
Algebra
ISBN:
9780079039897
Author:
Carter
Publisher:
McGraw Hill
