Name Course and Year 
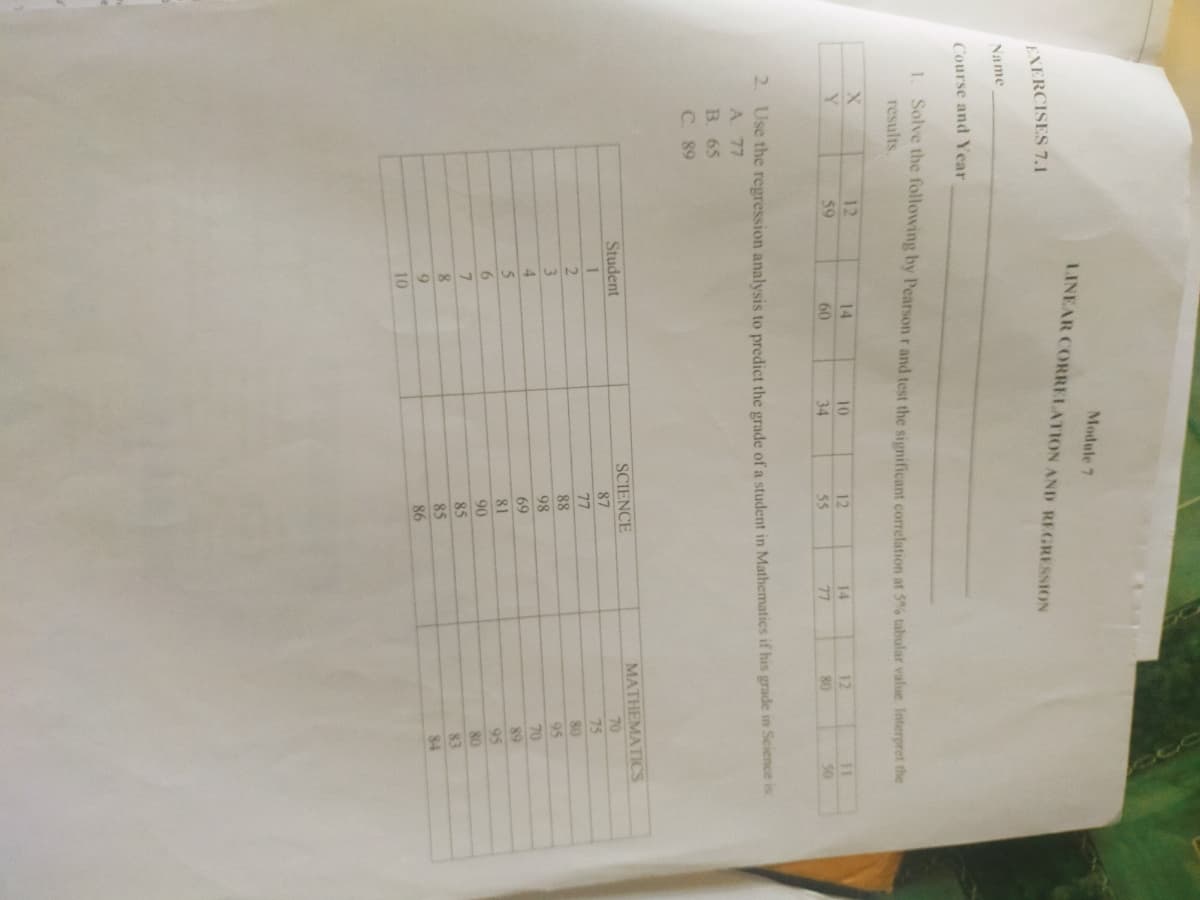
1. Solve the following by Pearson r and test the significant correlation at 5% tabular value. Interpret the results. X 12 14 10 12 14 12 11 Y. 59 60 34 55 77 80 50
Q: Which of the following sets of correlations correctly shows the highest to lowest degree of…
A: Given We have given the set of correlation and we need to find which set shows the highest to lowest…
Q: Vith which of the following scatterplots below does the correlation, r 0.09, match?
A: Here Given different scatter plots having different corelation
Q: Scatter Plot of Home Attendance by Home Score 500.00 400.00 6.6667 *x + -233.3333 300.00 200.00
A: x = Home score y = Home attendance
Q: Which of the following correlations represents the strongest possible relationship between X and Y?:…
A:
Q: Which of the following correlations reflects this relationship?
A: There are two variables Money to provide after-school activities Chance for the student to get…
Q: Create a scatter plot for the following. 15 17 40 40 X у 19 38 O positive correlation O negative…
A: Scatterplot: A pictorial manner of showing the relationship between two non-causal factors is…
Q: Which of the following values represents the strongest correlation between two variables? r = -0.92…
A: We have given the following statement about correlation.
Q: If through a scatter diagram we can see a linear and negative association with a coefficient of…
A: We have given that a linear and negative association with a coefficient of determination r2 = 0.81.
Q: 4. Find out Spearman's Rank correlation for the following data and write your comment. Profits 65 54…
A: The table represents the difference between the ranks of each pair. Rank of X Rank of Y di di^2…
Q: Find Spearman's rank coefficient of correlation from the following data : X: 50 66 34 21 15 79 42 Y:…
A:
Q: Suppose in a given problem about the correlation between height and weight of 20 college students,…
A: The value of r is 0.93. The value of the correlation coefficient is, r=0.93 Thus, the value of the…
Q: Evan wishes to determine if there is a linear correlation between the age of a driver and the death…
A: Solution
Q: me 6. Calculate Coefficient of Correlation between the values of X and Y given below: 68 Values of…
A:
Q: 1. 2. 3. 4.
A: Figure 1 of the scatter plot This shows that as one variable varies than other also varies in same…
Q: Here is a bivariate data set. y 78 24 78| 31 76 39 82 31 76 34 65 33 78 34 Find the correlation…
A: by using bivariate data set- x y x2 y2 x⋅y 78 24 6084 576 1872 78 31 6084 961 2418 76 39…
Q: 2. The following data chart shows the world record times for the 200 m race for flying start…
A: Since this is a multiple part question; only 1st 3 parts are answered. Part a The scatterplot can be…
Q: Use the table to find the following, unit price being your (x) and units sold (y). a. Find linear…
A:
Q: If the correlation coefficient r=-=0.9, then the coefficient of determination equals a. 8.1% b. 90%…
A: We know that, Coefficient of determination= (correlation coefficient)2
Q: #21 The scatter plot below, shows how much money was made by an ice cream shop from selling ice…
A:
Q: Given the following, determine what percent of variability in price can be explained by the age of a…
A: The correlation coefficient given is, r = -0.866 The formula for calculating the coefficient of…
Q: A real estate company wants to know the correlation of price of apartment purchased and the annual…
A: (a). Draw a scatterplot for the given data: Given data represents the values of Annual income (in…
Q: given below: Find Karl Pearson's Coefficient of Correlation between the values of X and y 79 68 61…
A: Given data is X 78 89 96 69 59 79 68 61 Y 125 137 156 112 107 136 123 108
Q: Which situation best demonstrates the phrase "correlation is not causation"? O As rainfall…
A:
Q: State whether the following statement is true or false: “The correlation between shoe size and…
A: Correlation measures the strength of association. According to the provided information, the…
Q: Erica is an inventor. Her portfolio tacks the performance of Google and wants to add the stock of…
A: Let the random variables, X and Y represent the Google data and Apple data, respectively. The…
Q: Which of the following values is most likely to represent the correlation coefficient for the data…
A: There is a positive/upward trend shown in the given scatterplot which means that two variables are…
Q: Age(x) 8 15 22 27 34 40 Sleep (y) 8 8 7 7 6.
A: The given table is x y 8 8 15 8 22 7 27 7 34 5 40 6
Q: Estimate the most likely degree of correlation for the scatterplot Options: a. -.99 b. 0 c.…
A: Correlation is the measure that used to determine the strength of association between the two…
Q: below. Income x 60 50 70 40 80 90 80 100 30 Meals y 8. 12 16 10 9. 10 7 Compute coefficient of…
A: x y (x-xbar) (x-xbar)^2 (y-ybar) (y-ybar)^2 (x-xbar)*(y-ybar) 60 8 -6.667 44.444 -1 1 6.667 50…
Q: If the correlation coefficient is –1, which answer is correct? Group of answer choices The slope of…
A: It is given that Correlation coefficient = -1
Q: Which data will most likely show a negative correlation when graphed on a scatterplot? A. the…
A: A negative correlation graph is the one in which the value of the dependent variable y decreases…
Q: For the data in the table, find the following values. Round each answer to 4 decimals. y 2 4 4. 5.…
A: Solution: x y x^2 y^2 x⋅y 2 4 4 16 8 4 6 16 36 24 5 9 25 81 45 6 10 36 100 60 7 18 49…
Q: Based on the data shown below, calculate the correlation coefficient (to three decimal places) y 4…
A: Given that the data are X Y 4 84 5 80.6 6 78.4 7…
Q: If the correlation coefficient is 0.930, what is the unexplained variation? O A. 7% О В. 93% ОС.…
A: From the provided information, Correlation coefficient (r) = 0.930
Q: Given the table below, use your calculator to find the Correlation Coefficient 3.9 4.6 1.7 8.3 3.5 y…
A:
Q: Which of the following sets of correlations shows the highest to lowest degree of relationship? A.…
A: Correlation: It is a statistical method that can be applied between the pairs of variables in…
Q: Given values of x and y, the correlation has a. very strong relationship. b. very strong negative…
A: Given: X Y 3 4 2 5 1 8 4 4 6 2
Q: Find the co-efficient of correlation for the following table : x: 10 14 18 22 26 30 y: 18 12 24 6 30…
A: Given data is x 10 14 18 22 26 30 y 18 12 24 6 30 36
Q: 4. Find out Spearman's Rank correlation for the following data and write your comment. Profits 65 54…
A: We have given that, The data set are:- X:- 65, 54, 46, 54, 38, 85, 46, 70, 68, 95 Y:- 55, 35, 40,…
Q: Use the data values in the table below to calculate the correlation between the variables x and y.…
A: Given Enter the given data in Excel sheet
Q: Given are 3 observations for two variables, x and y. 1 3 9 10 40 What is the value of the…
A: From the provided information, x 1 3 6 y 9 10 40
Q: Which of the following values represents the weakest correlation between two variables? r = -0.17 r…
A: The weakest correlation between two variables is B. r=0.07
Q: From the calculation that you obtained, interpret the correlation coefficient of the data found in…
A: The sample size n is 5.
Q: For the following scores: X Y 0 4 2 9 1 6 1 9 Draw a scatter plot. Is this a positive or negative…
A:
Q: a teacher asked her students how many hours of sleep they had the night before a test. what type…
A: Given information: Hours slept Score 8 83 7 86 7 74 8 88 6 76 5 63 7 90 4 60 9…
Q: Match each scatterplot shown below with one of the four specified correlations. 800 a. 0.09 b. 0.26…
A: Correlation: Correlation a measure which indicates the “go-togetherness” of two data sets. It can be…
Q: Suppose in a given problem about the correlation between height and weight of 20 college students,…
A: It was stated that in a given problem about the correlation coefficient between height and weight of…
Q: Perform the following tasks. (You may use extra sheets of paper for your solutions) 1. For each of…
A: Since you have asked multiple questions, we will solve first question for you. If you want any…
Step by step
Solved in 2 steps
- find the (a) explained variation, (b) unexplained variation, and (c) indicated prediction interval. In each case, there is sujficient evidence to support a claim of a linear correlation, so it is reasonable to use the regression equation when making predictions. Altitude and Temperature Listed below are altitudes (thousands of feet) and outside air temperatures (°F) recorded by the author during Delta Flight 1053 from New Orleans to Atlanta. For the prediction interval, use a 95% confidence level with the altitude of 6327 ft (or 6.327 thousand feet).randomly selected middle school students. Using this data, consider the equation of the regression line, yˆ=b0+b1x, for predicting the overall grade average for a middle school student based on the number of hours spent unsupervised each day. Keep in mind, the correlation coefficient may or may not be statistically significant for the data given. Remember, in practice, it would not be appropriate to use the regression line to make a prediction if the correlation coefficient is not statistically significant. Hours Unsupervised 1.5 2 3 3.5 4 4.5 5.5 Overall Grades 99 96 84 75 68 65 60 Table Step 1 of 6 : Find the estimated slope. Round your answer to three decimal places.randomly selected middle school students. Using this data, consider the equation of the regression line, yˆ=b0+b1x, for predicting the overall grade average for a middle school student based on the number of hours spent unsupervised each day. Keep in mind, the correlation coefficient may or may not be statistically significant for the data given. Remember, in practice, it would not be appropriate to use the regression line to make a prediction if the correlation coefficient is not statistically significant. Hours Unsupervised 1.5 2 3 3.5 4 4.5 5.5 Overall Grades 99 96 84 75 68 65 60 Table Find the estimated slope, y interscept and correlation coefficient Round your answers to three decimal places.
- The coefficient of determination of a set of data points is 0.842 and the slope of the regression line is −3.56. Determine the linear correlation coefficient of the data.The height in feet and number of stories of nine notable building in Atlanta are presented Please find the equation of the regression line for the given dates and construct graph y = mx+ b m = b = Please find out the correlation coefficient r. Please predict the number of stories for building height 635 feet. Hint: You can use formulas for m, b, and r from your chapter 9 of your PowerPoint theory file or use Excel program to speed up your calculation process. For assignment 3) use your graph from assignment 1) where x is 635 feet.Need asap please (under Correlation and Regression)
- The table below gives the age and bone density for five randomly selected women. Using this data, consider the equation of the regression line, yˆ=b0+b1x, for predicting a woman's bone density based on her age. Keep in mind, the correlation coefficient may or may not be statistically significant for the data given. Remember, in practice, it would not be appropriate to use the regression line to make a prediction if the correlation coefficient is not statistically significant. Age Bone Density34 35745 34148 33160 32965 325 Step 2 of 6: Find the estimated y-intercept. Round your answer to three decimal places.The table below gives the age and bone density for five randomly selected women. Using this data, consider the equation of the regression line, yˆ=b0+b1x, for predicting a woman's bone density based on her age. Keep in mind, the correlation coefficient may or may not be statistically significant for the data given. Remember, in practice, it would not be appropriate to use the regression line to make a prediction if the correlation coefficient is not statistically significant. Age Bone Density34 35745 34148 33160 32965 325 Step 6 of 6: Find the value of the coefficient of determination. Round your answer to three decimal places.The table below gives the age and bone density for five randomly selected women. Using this data, consider the equation of the regression line, yˆ=b0+b1x, for predicting a woman's bone density based on her age. Keep in mind, the correlation coefficient may or may not be statistically significant for the data given. Remember, in practice, it would not be appropriate to use the regression line to make a prediction if the correlation coefficient is not statistically significant. Age Bone Density34 35745 34148 33160 32965 325 Step 5 of 6: Determine if the statement "All points predicted by the linear model fall on the same line" is true or false.
- The table below gives the age and bone density for five randomly selected women. Using this data, consider the equation of the regression line, yˆ=b0+b1x, for predicting a woman's bone density based on her age. Keep in mind, the correlation coefficient may or may not be statistically significant for the data given. Remember, in practice, it would not be appropriate to use the regression line to make a prediction if the correlation coefficient is not statistically significant. Age Bone Density34 35745 34148 33160 32965 325 Step 3 of 6: Determine the value of the dependent variable yˆ at x=0.The table below gives the age and bone density for five randomly selected women. Using this data, consider the equation of the regression line, yˆ=b0+b1x, for predicting a woman's bone density based on her age. Keep in mind, the correlation coefficient may or may not be statistically significant for the data given. Remember, in practice, it would not be appropriate to use the regression line to make a prediction if the correlation coefficient is not statistically significant. Age Bone Density34 35745 34148 33160 32965 325 Step 4 of 6: Substitute the values you found in steps 1 and 2 into the equation for the regression line to find the estimated linear model. According to this model, if the value of the independent variable is increased by one unit, then find the change in the dependent variable yˆ.The table below gives the age and bone density for five randomly selected women. Using this data, consider the equation of the regression line, yˆ=b0+b1xy^=b0+b1x, for predicting a woman's bone density based on her age. Keep in mind, the correlation coefficient may or may not be statistically significant for the data given. Remember, in practice, it would not be appropriate to use the regression line to make a prediction if the correlation coefficient is not statistically significant. Age 3939 4141 5151 5858 6767 Bone Density 359359 352352 338338 324324 313313 Table Copy Data Step 4 of 6 : Substitute the values you found in steps 1 and 2 into the equation for the regression line to find the estimated linear model. According to this model, if the value of the independent variable is increased by one unit, then find the change in the dependent variable yˆy^.