Need help understanding this data Q1) create a hypothesis and understand the graphs for example.. seen in the figure. i.e. "There was a significant positive effect of coast of origin on shell size (t-value = 2.4, p<0.05; Figure 1)…" but be careful NOT to interpret the results (that is for a Discussion section). -You will state your hypothesis and whether it was supported or rejected based on your analysis, then state your results in real world terms. Next, you will state any trends or out of the normal values that were seen in the analysis or figure (be careful, again, NOT to interpret!).
Need help understanding this data Q1) create a hypothesis and understand the graphs for example.. seen in the figure. i.e. "There was a significant positive effect of coast of origin on shell size (t-value = 2.4, p<0.05; Figure 1)…" but be careful NOT to interpret the results (that is for a Discussion section). -You will state your hypothesis and whether it was supported or rejected based on your analysis, then state your results in real world terms. Next, you will state any trends or out of the normal values that were seen in the analysis or figure (be careful, again, NOT to interpret!).

Glencoe Algebra 1, Student Edition, 9780079039897, 0079039898, 2018
18th Edition
ISBN:9780079039897
Author:Carter
Publisher:Carter
Chapter1: Expressions And Functions
Section1.6: Relations
Problem 32PPS

Related questions
Question
Need help understanding this data
Q1) create a hypothesis and understand the graphs for example..
seen in the figure. i.e. "There was a significant positive effect of coast of origin on shell size (t-value = 2.4, p<0.05; Figure 1)…" but be careful NOT to interpret the results (that is for a Discussion section).
-You will state your hypothesis and whether it was supported or rejected based on your analysis, then state your results in real world terms. Next, you will state any trends or out of the normal values that were seen in the analysis or figure (be careful, again, NOT to interpret!).
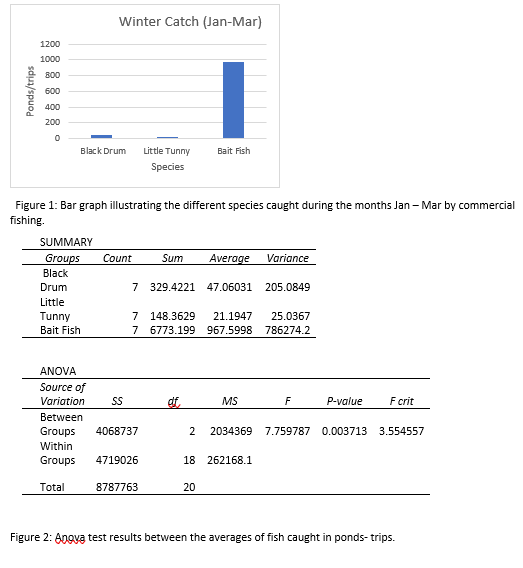
Transcribed Image Text:Winter Catch (Jan-Mar)
1200
1000
800
600
400
200
0
Black Drum
Little Tunny Bait Fish
Species
Figure 1: Bar graph illustrating the different species caught during the months Jan-Mar by commercial
fishing.
SUMMARY
Groups
Count
Sum
Average
Variance
Black
Drum
7 329.4221 47.06031 205.0849
Little
Tunny
7
148.3629 21.1947
25.0367
7 6773.199 967.5998 786274.2
Bait Fish
ANOVA
Source of
Variation
SS
ef
MS
F
P-value
F crit
Between
Groups 4068737
2 2034369 7.759787 0.003713 3.554557
Within
Groups 4719026
18 262168.1
Total
8787763
20
Figure 2: Angya test results between the averages of fish caught in ponds-trips.
Ponds/trips
Expert Solution
This question has been solved!
Explore an expertly crafted, step-by-step solution for a thorough understanding of key concepts.

Step by step
Solved in 3 steps

Recommended textbooks for you
Glencoe Algebra 1, Student Edition, 9780079039897…
Algebra
ISBN:
9780079039897
Author:
Carter
Publisher:
McGraw Hill

Algebra & Trigonometry with Analytic Geometry
Algebra
ISBN:
9781133382119
Author:
Swokowski
Publisher:
Cengage

Functions and Change: A Modeling Approach to Coll…
Algebra
ISBN:
9781337111348
Author:
Bruce Crauder, Benny Evans, Alan Noell
Publisher:
Cengage Learning
Glencoe Algebra 1, Student Edition, 9780079039897…
Algebra
ISBN:
9780079039897
Author:
Carter
Publisher:
McGraw Hill
Algebra & Trigonometry with Analytic Geometry
Algebra
ISBN:
9781133382119
Author:
Swokowski
Publisher:
Cengage
Functions and Change: A Modeling Approach to Coll…
Algebra
ISBN:
9781337111348
Author:
Bruce Crauder, Benny Evans, Alan Noell
Publisher:
Cengage Learning
