Need help with this and please show me how do to do the graphs too, where to put the colors for each person. Here is the possible answers to the empty spots. READ CAREFULLY and Remember its all part of a same question! 1. Based on the information on the previous graph, you can tell that___________(Choose one of the following: 1,2,3,4 or 5 cosumers) will buy smart phones at the given market price, and total consumer surplus in this market will be______$ 2. Based on the information in the second graph, when the market price of a smart phone decreases to $60, the number of consumers willing to buy a smart phone__________(Choose one of the following: increases or decreases) to_________(Choose one of the following: 1,2,3,4 or 5 cosumers


Need help with this and please show me how do to do the graphs too, where to put the colors for each person.
Here is the possible answers to the empty spots. READ CAREFULLY and Remember its all part of a same question!
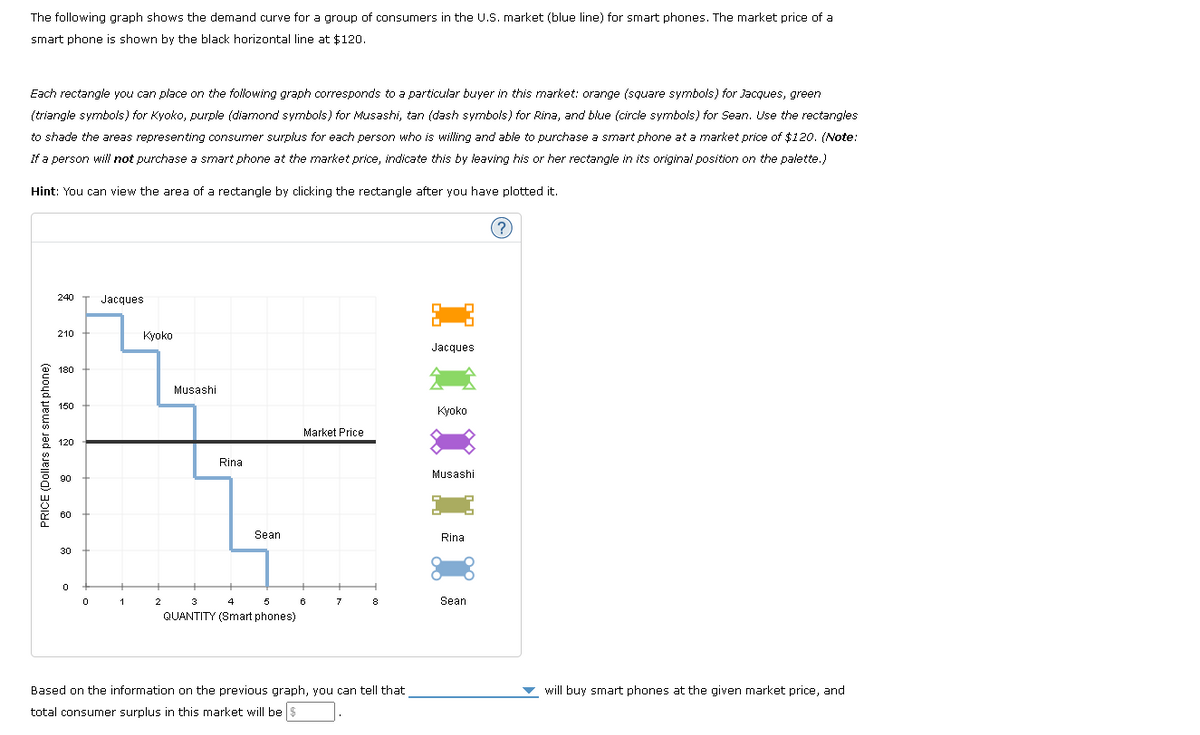
1. Based on the information on the previous graph, you can tell that___________(Choose one of the following: 1,2,3,4 or 5 cosumers) will buy smart phones at the given market price, and total
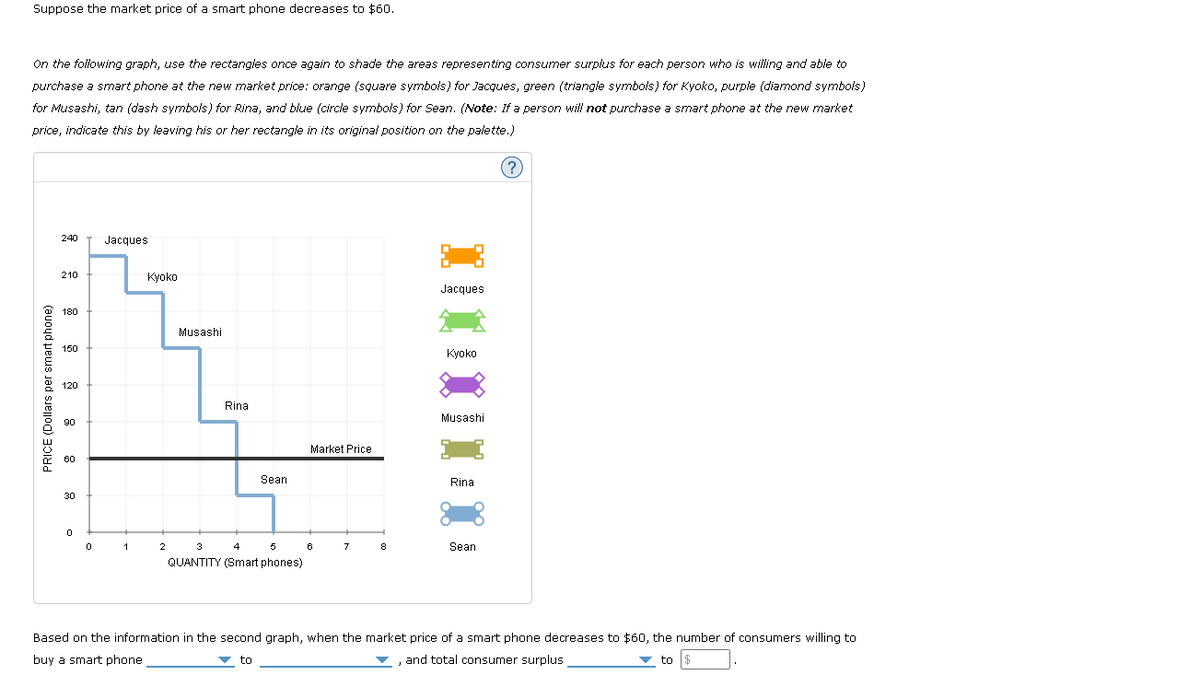
2. Based on the information in the second graph, when the market price of a smart phone decreases to $60, the number of consumers willing to buy a smart phone__________(Choose one of the following: increases or decreases) to_________(Choose one of the following: 1,2,3,4 or 5 cosumers), and total consumer surplus________(Choose one of the following: increases or decreases) to________$

Step by step
Solved in 3 steps with 2 images


