Need help with this. I did it I just want to make sure I did mine right before submitting it! thank you in advance Bees Data: KY Honey Harvest (lb) MO Honey Harvest (lb) 61.8 57.1 53.6 62.1 50.2 53.5 47.0 77.1 46.6 57.1 51.8 60.5 70.0 56.4 59.7 60.4 56.6 71.8 53.0 62.8 59.7 59.2 44.1 59.5 44.5 59.3 53.3 55.9 60.2 66.3 55.6 63.1 53.6 56.6 58.2 60.0 40.1 54.1 56.8 60.9 60.0 69.7 45.8 59.2 53.5 68.4 58.2 65.3 49.3 55.8 47.4 68.5 43.4 51.2 49.9 65.4 57.2 65.8 66.8 61.5 59.7 66.8 53.1 63.8 56.5 61.7 Greek data: August (bacteria per 100 ml water) October (bacteria per 100 ml water) 310 301 299 335 421 232 265 239 391 311 274 238 327 295 300 274 222 293 276 331 375 328 225 252 351 320 510 256 332 260 411 285 349 218 527 319 349 365 375 298 366 236 276 297 339 312 335 302 334 333 333 300 334 335 338 308 340 313 337 315 339 314 331 302 334 303 327 305 316 310 304 314 319 303 294 309 299 307 311 309


Inverse Normal Distribution
The method used for finding the corresponding z-critical value in a normal distribution using the known probability is said to be an inverse normal distribution. The inverse normal distribution is a continuous probability distribution with a family of two parameters.
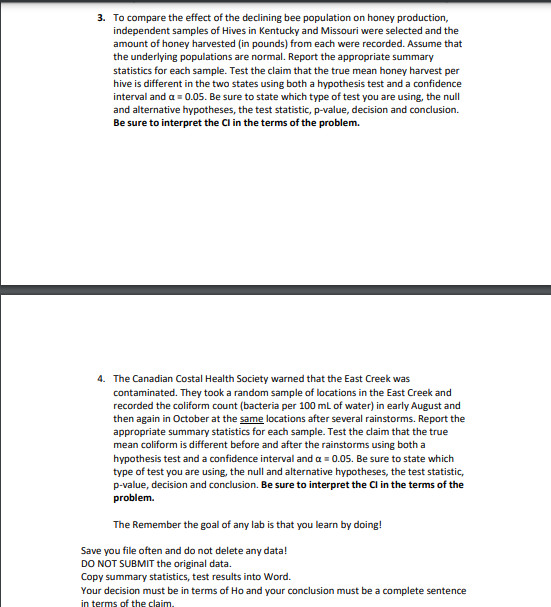
Mean, Median, Mode
It is a descriptive summary of a data set. It can be defined by using some of the measures. The central tendencies do not provide information regarding individual data from the dataset. However, they give a summary of the data set. The central tendency or measure of central tendency is a central or typical value for a probability distribution.
Z-Scores
A z-score is a unit of measurement used in statistics to describe the position of a raw score in terms of its distance from the mean, measured with reference to standard deviation from the mean. Z-scores are useful in statistics because they allow comparison between two scores that belong to different normal distributions.
Need help with this. I did it I just want to make sure I did mine right before submitting it! thank you in advance
Bees Data:
| KY Honey Harvest (lb) | MO Honey Harvest (lb) |
| 61.8 | 57.1 |
| 53.6 | 62.1 |
| 50.2 | 53.5 |
| 47.0 | 77.1 |
| 46.6 | 57.1 |
| 51.8 | 60.5 |
| 70.0 | 56.4 |
| 59.7 | 60.4 |
| 56.6 | 71.8 |
| 53.0 | 62.8 |
| 59.7 | 59.2 |
| 44.1 | 59.5 |
| 44.5 | 59.3 |
| 53.3 | 55.9 |
| 60.2 | 66.3 |
| 55.6 | 63.1 |
| 53.6 | 56.6 |
| 58.2 | 60.0 |
| 40.1 | 54.1 |
| 56.8 | 60.9 |
| 60.0 | 69.7 |
| 45.8 | 59.2 |
| 53.5 | 68.4 |
| 58.2 | 65.3 |
| 49.3 | 55.8 |
| 47.4 | 68.5 |
| 43.4 | 51.2 |
| 49.9 | 65.4 |
| 57.2 | 65.8 |
| 66.8 | 61.5 |
| 59.7 | 66.8 |
| 53.1 | 63.8 |
| 56.5 | 61.7 |
Greek data:
| August (bacteria per 100 ml water) | October (bacteria per 100 ml water) |
| 310 | 301 |
| 299 | 335 |
| 421 | 232 |
| 265 | 239 |
| 391 | 311 |
| 274 | 238 |
| 327 | 295 |
| 300 | 274 |
| 222 | 293 |
| 276 | 331 |
| 375 | 328 |
| 225 | 252 |
| 351 | 320 |
| 510 | 256 |
| 332 | 260 |
| 411 | 285 |
| 349 | 218 |
| 527 | 319 |
| 349 | 365 |
| 375 | 298 |
| 366 | 236 |
| 276 | 297 |
| 339 | 312 |
| 335 | 302 |
| 334 | 333 |
| 333 | 300 |
| 334 | 335 |
| 338 | 308 |
| 340 | 313 |
| 337 | 315 |
| 339 | 314 |
| 331 | 302 |
| 334 | 303 |
| 327 | 305 |
| 316 | 310 |
| 304 | 314 |
| 319 | 303 |
| 294 | 309 |
| 299 | 307 |
| 311 | 309 |


Trending now
This is a popular solution!

Step by step
Solved in 3 steps with 7 images


