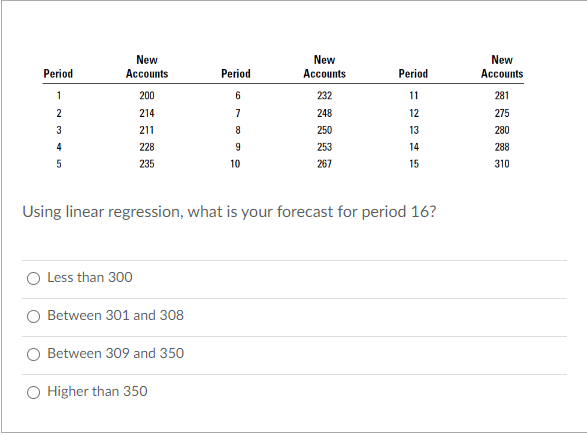
New Accounts Period New Accounts Period 200 6 232 11 214 248 12 3 211 250 13 4 228 253 14 235 10 267 15 Using linear regression, what is your forecast for period 16? O Less than 300 Between 301 and 308 Between 309 and 350 Period 1 2 O Higher than 350 New Accounts 281 275 280 288 310


Q: Why is scheduling important in planning and production?
A: Production is the process of transforming the raw materials and resources into finished products and…
Q: In a synchronous production strategy, storage and shortage costs tend to be high.
A: Synchronous manufacturing is where production takes place at different centers. The rate of…
Q: The local driver's license center processes applications for driver's license renewals through the…
A: Time is taken for Step-1 = 3 minutes per customer No. of resources = 1 receptionist Time taken for…
Q: The local driver's license center processes applications for driver's license renewals through the…
A: Time taken for Step-1 = 3 minutes per customer No. of resources = 1 receptionist Time taken for…
Q: ...Takes resources from the environment and processes them to produce outputs Organizations…
A: A stable, formal social structure that indeed receives resources from the environment and processes…
Q: Identify the ten supply chain risks. Next, select two that you think are of greater risk than some…
A: A supply chain shows the operating activities to deliver finished goods to the customers. A supply…
Q: IT can reduce agency costs O by reducing the number of employees by minimizing the cost of…
A: Information technologies have grown into vital, online, interactive instruments that are extensively…
Q: Is it really possible to assess the quality of software when the customer keeps changing their minds…
A: Software quality is the features and functions of a software product to meet certain requirements.…
Q: 1) The price function ( 2) The weekly revenue functiofi, and the cost function. ( 3) The…
A: Let no. of units sole be x Let the price per unit be p The linear equation for the given problem…
Q: Hennes & Mauritz AB (H&M) is a Swedish multinational clothing-retail company known for its…
A: The case is about a clothing retail company founded in Sweden in 1947. The company is facing the…
Q: Hennes & Mauritz AB (H&M) is a Swedish multinational clothing-retail company known for its…
A: Economic benefit Those benefits which are gained by organizations in terms of increased income or…
Q: Where do risk management and risk assessment diverge from one another?
A: Risk management is the activity of recognizing, estimating, and managing risks that can damage an…
Q: A toy manufacturer uses 48,000 rubber wheels per year for its dump truck. The trucks are assembled…
A:
Q: (a) Find the optimal order size and order frequency for the importer to minimise their costs.…
A: Optimal order size undervalues its total costs linked to ordering, receiving, and holding inventory.…
Q: erformance improven . List the major type ogies and describes management.
A: The processing of data by means of a computer is what is referred to as information technology. Data…
Q: Give three (3) examples showing how integration and collaboration along the supply chain can be…
A: Supply chain management can seem like a daunting task when done alone. Still, with the right set of…
Q: When looking at the total quality management model, the interface between quality systems and…
A: Total Quality Management is the managing process that is based on the concept that all workers or…
Q: How does supply-chain management encourage cooperation between buyers and sellers?
A: Supply chain management is described as a process through which demand management and supply…
Q: REQUIRED: Perform analysis for the Ocobee River Rafting Company to determine which alternative would…
A: Break-even analysis is one of the methods that are commonly and widely used in manufacturing…
Q: You have the following information: - Ordering cost: $300/order - Carrying cost (Carrying cost):…
A: Inventory management is described as a process through which items are sourced, stored, and then…
Q: Suzanne just received her paycheque and sees that she was paid $750 for producing 50 widgets. Her…
A: The question is related to paymemt system to employees. Employees are motivated with rewards for…
Q: Oslo Company's target quality characteristic, T, for one of its key components is set at 88. Using…
A: The Taguchi loss function demonstrates how each non-perfect part manufactured causes the…
Q: 11. Hart Manufacturing makes three products. Each product requires manufacturing operations in three…
A: Suppose- P1= No. of units produced of Product 1 P2= No. of units produced of Product 2 P3= No. of…
Q: How does system utilization and waiting line interrelate?
A: Waiting line model or queueing models deal with the problems or situations that arise due to the…
Q: hich statement below is True, and which one is False? For the False ones explain why they are…
A: 3-1) The process imperfections or the imperfect process are the outcome of the waste in the process.…
Q: ull capacity
A: Depending on how they carry out their duties, employees may either be a company's greatest asset or…
Q: Joe's Twenty-four Seven Laundromat has the following jobs waiting to be processed. The first step of…
A: The sequence of operation is given as First Come First Serve i.e. A-B-C-D-E. Here, the 1st operation…
Q: 4. What is the total carrying cost of Beta per year under the EOQ policy? 5. What is the total cost…
A: EOQ stands for economic order quantity. It is a company's optimal order quantity that undervalues…
Q: Is my formatting correct (see attached image)? I'm still having trouble with getting that graph.…
A: The given data is Objective function: Max Z=250D+145C Subject to constraints: 1.) 4D+3C≤20002.)…
Q: What happened to the Planting Process, the answer is partially answered
A: Scheduling – the method of deciding what task to assign to which of the resources & when to…
Q: A new start-up company is conducting a SOP meeting in order to "plan ahead" to effectively address…
A: Production net requirement: Excel model: Solution:
Q: Use the schedule below to answer these questions. (Assume a 5-day work week, weekends are shown as…
A: Find the Given details below: ID Task name Duration(Days) Included Weekends(Days) Predecessors…
Q: Steps to reduce the temptations and distractions that impede the growth of the workforce.
A: Temptations and distractions at the workplace refer to those important activities that are very…
Q: Problem 2: The activity details and their predecessors are given below along with their activity…
A: A network diagram is a visual representation of a project which helps to identify the activity…
Q: 19. Hale's TV Productions is considering producing a pilot for a comedy series in the hope of…
A: States of Nature s1 s2 s3 Decision Alternatives Produce Pilot d1 -100 50 150 Sell to…
Q: TYPEWRITTEN ONLY PLEASE. ILL UPVOTE ONLY IF TYPEWRITTEN, COMPLETE, AND CORRECT. DONT ANSWER IF YOU…
A: In the given first we will calculate the total cost of both the plans and then the plan having the…
Q: Construct an organizational chart for an international company with divisions in Europe, South…
A: An organization chart, at times known as an "org chart," is undoubtedly a graphic that shows a…
Q: Differentiate between Fixed Order Quantity Model, Fixed Time Period Model and Determine the Economic…
A: The most significant distinction between the fixed order quantity and fixed time period systems is…
Q: nalyse the principles, strategies of effective procurement and sourcing processes that would boost…
A: A procurement strategy fact how a corporate should agree with its obtaining process. This offers an…
Q: The local driver's license center processes applications for driver's license renewals through the…
A: Time taken for Step-1 = 3 minutes per customer No. of resources = 1 receptionist Time taken for…
Q: A management consultant is evaluating the effectiveness of the control systems at AAA Corporation.…
A: Feedforward controls take place before a work activity is done. Concurrent controls take place while…
Q: Discuss the advantages and disadvantages of EDI in detail.
A: Electronic data interchange can be defined as a new emerging technology used for the transfer of the…
Q: Describe the Project Benefit Realization process.
A: Benefits realization management (BRM) is a program that helps in measuring the added value of the…
Q: Identify some technological advances that can serve to improve logistics management and also improve…
A: Technology continues pushing the envelope and transforming the way the globe does commerce. We've…
Q: what would prompt an organizatio
A: The proprietors of a business are not fortune-tellers. It's impossible to foresee the future…
Q: A plastic bags factory has controls over the quality of the raw material. This type of control is…
A: Feedforward controls take place before a work activity is done. Concurrent controls take place while…
Q: A work group of 10 workers in a certain month produced 7200 units of output working 8 hr/day for 22…
A: The question is related to Production Management and Productivity. The details are given
Q: Jamie McCullough, owner of Leisure World, Inc., is worried about his business’ future. He has tried…
A: Jamie McCullough is a self-driven, self-motivated, and very inspired individual to make his…
Q: state whether it is true or false that kaizen is a Chinese concept that relates to development of a…
A: Introduction: Continuous improvement or "improvement" is what Kaizen means in the Japanese language.…
Q: Luis, MO). The supplier can ship every day, ever here is a penalty of $0.30/cwt for each day delaye…
A: Given: Each day delay Penalty=$0.30/cwt Shipment Transportation rate ($/cwt) City…

Step by step
Solved in 3 steps with 6 images

- The owner of a restaurant in Bloomington, Indiana, has recorded sales data for the past 19 years. He has also recorded data on potentially relevant variables. The data are listed in the file P13_17.xlsx. a. Estimate a simple regression equation involving annual sales (the dependent variable) and the size of the population residing within 10 miles of the restaurant (the explanatory variable). Interpret R-square for this regression. b. Add another explanatory variableannual advertising expendituresto the regression equation in part a. Estimate and interpret this expanded equation. How does the R-square value for this multiple regression equation compare to that of the simple regression equation estimated in part a? Explain any difference between the two R-square values. How can you use the adjusted R-squares for a comparison of the two equations? c. Add one more explanatory variable to the multiple regression equation estimated in part b. In particular, estimate and interpret the coefficients of a multiple regression equation that includes the previous years advertising expenditure. How does the inclusion of this third explanatory variable affect the R-square, compared to the corresponding values for the equation of part b? Explain any changes in this value. What does the adjusted R-square for the new equation tell you?The Baker Company wants to develop a budget to predict how overhead costs vary with activity levels. Management is trying to decide whether direct labor hours (DLH) or units produced is the better measure of activity for the firm. Monthly data for the preceding 24 months appear in the file P13_40.xlsx. Use regression analysis to determine which measure, DLH or Units (or both), should be used for the budget. How would the regression equation be used to obtain the budget for the firms overhead costs?The file P13_42.xlsx contains monthly data on consumer revolving credit (in millions of dollars) through credit unions. a. Use these data to forecast consumer revolving credit through credit unions for the next 12 months. Do it in two ways. First, fit an exponential trend to the series. Second, use Holts method with optimized smoothing constants. b. Which of these two methods appears to provide the best forecasts? Answer by comparing their MAPE values.
- The file P13_02.xlsx contains five years of monthly data on sales (number of units sold) for a particular company. The company suspects that except for random noise, its sales are growing by a constant percentage each month and will continue to do so for at least the near future. a. Explain briefly whether the plot of the series visually supports the companys suspicion. b. By what percentage are sales increasing each month? c. What is the MAPE for the forecast model in part b? In words, what does it measure? Considering its magnitude, does the model seem to be doing a good job? d. In words, how does the model make forecasts for future months? Specifically, given the forecast value for the last month in the data set, what simple arithmetic could you use to obtain forecasts for the next few months?The file P13_29.xlsx contains monthly time series data for total U.S. retail sales of building materials (which includes retail sales of building materials, hardware and garden supply stores, and mobile home dealers). a. Is seasonality present in these data? If so, characterize the seasonality pattern. b. Use Winters method to forecast this series with smoothing constants = = 0.1 and = 0.3. Does the forecast series seem to track the seasonal pattern well? What are your forecasts for the next 12 months?The file P13_26.xlsx contains the monthly number of airline tickets sold by the CareFree Travel Agency. a. Create a time series chart of the data. Based on what you see, which of the exponential smoothing models do you think will provide the best forecasting model? Why? b. Use simple exponential smoothing to forecast these data, using a smoothing constant of 0.1. c. Repeat part b, but search for the smoothing constant that makes RMSE as small as possible. Does it make much of an improvement over the model in part b?
- The file P13_28.xlsx contains monthly retail sales of U.S. liquor stores. a. Is seasonality present in these data? If so, characterize the seasonality pattern. b. Use Winters method to forecast this series with smoothing constants = = 0.1 and = 0.3. Does the forecast series seem to track the seasonal pattern well? What are your forecasts for the next 12 months?The file P13_22.xlsx contains total monthly U.S. retail sales data. While holding out the final six months of observations for validation purposes, use the method of moving averages with a carefully chosen span to forecast U.S. retail sales in the next year. Comment on the performance of your model. What makes this time series more challenging to forecast?Under what conditions might a firm use multiple forecasting methods?
- A small computer chip manufacturer wants to forecast monthly ozperating costs as a function of the number of units produced during a month. The company has collected the 16 months of data in the file P13_34.xlsx. a. Determine an equation that can be used to predict monthly production costs from units produced. Are there any outliers? b. How could the regression line obtained in part a be used to determine whether the company was efficient or inefficient during any particular month?Suppose that a regional express delivery service company wants to estimate the cost of shipping a package (Y) as a function of cargo type, where cargo type includes the following possibilities: fragile, semifragile, and durable. Costs for 15 randomly chosen packages of approximately the same weight and same distance shipped, but of different cargo types, are provided in the file P13_16.xlsx. a. Estimate a regression equation using the given sample data, and interpret the estimated regression coefficients. b. According to the estimated regression equation, which cargo type is the most costly to ship? Which cargo type is the least costly to ship? c. How well does the estimated equation fit the given sample data? How might the fit be improved? d. Given the estimated regression equation, predict the cost of shipping a package with semifragile cargo.Stock market analysts are continually looking for reliable predictors of stock prices. Consider the problem of modeling the price per share of electric utility stocks (Y). Two variables thought to influence this stock price are return on average equity (X1) and annual dividend rate (X2). The stock price, returns on equity, and dividend rates on a randomly selected day for 16 electric utility stocks are provided in the file P13_15.xlsx. Estimate a multiple regression equation using the given data. Interpret each of the estimated regression coefficients. Also, interpret the standard error of estimate and the R-square value for these data.

