nformation, calculate the value of Pearson Correlation Coefficient, r. Enter your answer to three decima laces. = 10; Σ := 23.7;
nformation, calculate the value of Pearson Correlation Coefficient, r. Enter your answer to three decima laces. = 10; Σ := 23.7;

Glencoe Algebra 1, Student Edition, 9780079039897, 0079039898, 2018
18th Edition
ISBN:9780079039897
Author:Carter
Publisher:Carter
Chapter4: Equations Of Linear Functions
Section4.5: Correlation And Causation
Problem 11PPS

Related questions
Question
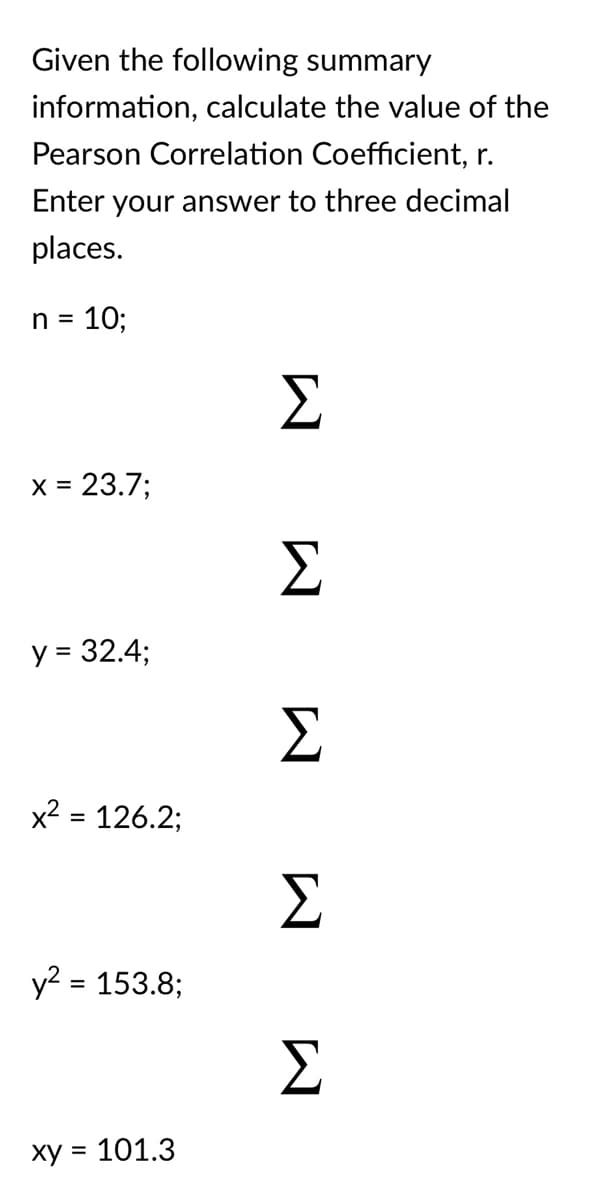
Transcribed Image Text:Given the following summary
information, calculate the value of the
Pearson Correlation Coefficient, r.
Enter your answer to three decimal
places.
n =
10;
Σ
X =
23.7;
y = 32.4;
Σ
x² = 126.2;
%3D
y? = 153.8;
Σ
ху 3 101.3
Expert Solution
This question has been solved!
Explore an expertly crafted, step-by-step solution for a thorough understanding of key concepts.

This is a popular solution!

Trending now
This is a popular solution!

Step by step
Solved in 2 steps with 2 images

Recommended textbooks for you
Glencoe Algebra 1, Student Edition, 9780079039897…
Algebra
ISBN:
9780079039897
Author:
Carter
Publisher:
McGraw Hill
Glencoe Algebra 1, Student Edition, 9780079039897…
Algebra
ISBN:
9780079039897
Author:
Carter
Publisher:
McGraw Hill