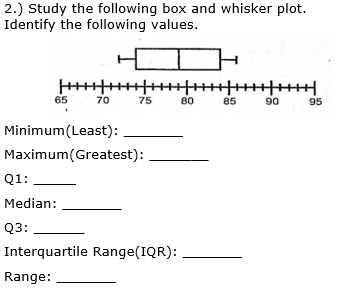
niske plot. Identify the following values. 65 70 75 80 85 90 95 Minimum(Least): Maximum(Greatest): Q1: Median: Q3: Interquartile Range(IQR): Range:


Q: 15. The heights of 11 basketball players, in inches, are given below. 67, 68, 69, 70, 70, 70, 72,…
A:
Q: Using the following stem & leaf plot, find the five number summary for the data by hand. 1|29 215 79…
A:
Q: What is the median of this box plot? ¿Cuál es la mediana de este diagrama de caja? 3 4. 6. 7 8 6. 10…
A: The median marks the mid-point of the data and is shown by the line that divides the box into two…
Q: Using the following stem & leaf plot, find the five number summary for the data by hand. 1|18 215 6…
A:
Q: Use the below dot plot to answer questions 1-4. In game one of a high school basketball playoff, the…
A: Given The dot plot is as follows:
Q: Draw a scatter plot.
A: Hello, since your question has multiple sub-parts, we will solve the first three sub-parts for you.…
Q: 30 25 20 15 10 하 10 20 30 40 50 60 70 80 90 85 70 55
A:
Q: Use the side-by-side boxplots shown to complete parts (a) through (e). y 30 60 90 120 (a) What is…
A: We have to find correct option.
Q: Given the data, create a stem and leaf plot. Using the stem and leaf plot solve for the mean and…
A: Given that The data are X=12,13,21,27,33,34,35,37,40,40,41,56
Q: Use the box-and-whisker plot to identify the five-number summary. ww.... Min = 11 14 16 17 21 12 14…
A:
Q: Find the best straight line fit to the given data points: (-3, 7); (1, -1); and (3, -7)
A:
Q: a. Construct a stem-and -leaf display of the data. What is the range of the data? b. What proportion…
A: Here use ascending order of data for making stem leaf plot In leaf last digit only represented
Q: use the data in the stem ¢le plot to questions. answer the tollowing STEM LEAF 56 1135 591 395…
A: Given data is,5,6,11,11,13,15,21,25,29,33,35,39,42,42,42,44,47,4850,54
Q: Below is a box plot representing hours that teenagers spend on video games per week. a. What is the…
A: Solution: The objective is to find the median, range and interquartile range from the given box…
Q: Represent each set of data in a dot plot. Determine the median, mode, and range. 1. Student Height…
A:
Q: median, Q3, and high. (b) Find the interquartile range.
A: Given : Consider the following ordered data. 4 7 7 8 9 9 10 11 12
Q: Which line represents the best fit for the scatter plot data? 10 8. 6. 4 2 o2 4 6 8 10 10 6. 4. 2 O…
A: First graph is the best fit for the scatter plot data.
Q: If all the plots on a scatter diagram lie on a straight line, what is the standard error of…
A: If all the plots on a scatter diagram lie on a straight line, it means that the predicted value is…
Q: Use a stem-and-leaf plot to display the data, which represent the numbers of hours 24 nurses work…
A:
Q: Four groups of people reported the number of hours of television that they watched last week. The…
A: We need to find dotplot which has highest median
Q: Determine the range, quartiles and interquartile range for the following data set: 36, 40, 32, 28,…
A: we have given data 36,40,32,28,27,35,42,28,35,38,32 First arrange the data in ascending order:…
Q: Consider the four pairs of dotplots. Each dotplot represents a set of measurements. For which…
A: When we observe at pairs of dotplots, the one with the higher standard deviation will display data…
Q: If all the plots on a scatter diagram lie on a straight line, what is the standard error of…
A: Scatter diagram: It is a tool for analyzing the correlation between the dependent variable and…
Q: Twenty-six football players ran a lap after practice. Their lap times in seconds are shown in the…
A: From given stem and leaf the data values…
Q: By plotting the graph of the given data mention whether there is a positive trend, negative trend or…
A: The graph of the given data can be obtained using excel steps as follow: Enter the data into excel…
Q: Use a stem-and-leaf plot to display the data, which represent the numbers of hours 24 nurses work…
A: For given data the stem and leaf plot will look like as follows 2 | 3 3 | 002235666689 4 |…
Q: What type of association does the following scatter plot have: 7乃 40 30 55 70 75 Husband's Age O…
A: We have to check
Q: 1. Given the set of data, 20, 14, 23, 9, 7, 13, 29, 9, 16 Find (iii) the interquartile range. (i)…
A: Given data is 20,14,23,9,7,13,29,9,16Arrange the data in ascending…
Q: In which scatter plot is r = 0.01? O c e
A: The value of correlation would be 0 or closer to 0 when there is no linear association between the…
Q: These are the times, in seconds, that 15 members of an athletics club took to run 800 metres. 139…
A: 1)
Q: Which of the following dot plots represent the data below? Hours Slept 6. 8 7 5 6 5 7 7 10 7
A:
Q: Here is the 5 Number Summary for a set of data: 1.55 2.8 3 3.44 3.93…
A: The five number summary for a set of data is 1.55, 2.8, 3, 3,44 and 3.93.
Q: Which box-and-whisker plot represents the following information? Temperature: 88, 80, 79, 100 ,60,…
A: Given data, 88,80,79,100,60,79,84 Population size: 7Median: 80Minimum: 60Maximum: 100First…
Q: Given the following box-and-whisker plot, values above what number would be considered an upper…
A:
Q: 5. Students from a statistics class were asked to record their heights in inches: 65 72 68 64 60 55…
A: As per our guidelines we can solve first three subpart and rest can be reposted. Solution-: Given…
Q: Label the box plot with the following letters. A. Median B. Greatest Value C. Smallest Value D.…
A:
Q: Make a box-and-whisker plot. Label the minimum, maximum, first quartile, median, and third quartile.…
A: Given:- Daily Attendance: 29,24,28,32,30,31,26,33 To Find That:- Make a box and whisker plot. Label…
Q: er the following data sets: 28 28 37 31 24 29 8 27 24 12 21 32 27 24 23 33 struct a stem-and-leaf…
A: a). We are given that stems are from 0 to 9. This is also called stem and leaf plot with one line…
Q: Using the data represented in the box-and -whisker plot below, answer the questions 9 and 10: Foot…
A:
Q: Choose the correct plot below.
A: Using the given Data we have to draw the Normal Probability Plot We know that the Normal Probability…
Q: The dot plots shows the number of miles run per week for two different math classes at Cypress…
A: Statement (A) is false because in class A there are 5+3+2+1+4+2=17 students and in class B there are…
Q: 01 23 45 6 7 8 9 10 11 12 Runs ...
A: It is asked to find the range, median, and the first and third quartiles and the interquartile range…
Q: Use the side-by-side boxplots shown to complete parts (a) through (e). 30 60 90 120 (a) What is the…
A: Boxplot :
Q: Which of the following must be entries from the original data set the mode the range the third…
A: i) The mode is the maximum frequency or the most repeated observation from the data set. ii)Rage is…
Q: Using the same scale, draw a box-and-whisker plot for each of the two data sets, placing the second…
A: Arrange the data in ascending order. NBA 75 76 77 77 77 78 79 79 79 79 82…
Q: Consider the following ordered data. 2 5 5 6 7 7 8 9 10 Find the low, Q1, median,…
A:
Q: 40 Which of the following information is NOT true about a box plot? *
A: Here use box plot representation of left ,right and symmetric distribution
Q: The five-number summary for a data set Is given by mm = 5. Q1 = 18. medIan = 20. Q = 40. max = 75.…
A: Given information : Min = 5 Q1 = 18 Median = 20 Q3 = 40 Max = 75 To detect Outliers: Values lies…
Q: The five number summary for a set of data is given below. Min Q1 Median Q3 Max 54 56 80 86 87…
A: Interquartile range:The difference between the third and first quartiles of the data is termed as…
Q: Stem-and-leaf plots have two parts. O True O False
A: The given statement is stem-and-leaf plots have two parts.
study the following box and whisker plot identify the follwoing values.

Step by step
Solved in 3 steps with 2 images


- Given the following data for 25 male students, build a modified box plot and identify the required statistics. Weight (lb): 123 134 140 148 149 150 150 150 155 158 160 160 163 170 170 175 175 175 180 185 190 195 223 231 -Identify the median for this data -identify the interquartile range -identify the value of the upper limit -identify the value of the adjacent Ppoint -is the minimum the adjacent point?Complete the five number summary for the box and whisker plot. * 0 3 6 11 12 16 21 22 Upper Extreme Lower Extreme Q1 Median Q3study the following box and whisker plot identify the follwoing values.
- This bargraph attached illustrates the responses of different age groups to the following inquiry: "Over the past week, how often did you maintain the recommended 2-meter COVID social distance rule?" What ONE of the below options can be inferred from the graph? a) The plot reveals that a majority of individuals across all age groups tend to practice 2-meter social distancing at least some of the time. b) It indicates that the likelihood of adhering to 2-meter social distancing tends to increase with age. c)The plot suggests a correlation between age groups and the adherence to 2-meter social distancing. d) Notably, a considerable number of adults aged 55 to 64 do not maintain a 2-meter social distance.Consider the following ordered data. 4 7 7 8 9 9 10 11 12 Find the low, Q1, median, Q3, and high Find the interquartile rangeFind the range, median, and the first and third quartiles and the interquartile range for the dot plot below
- Given the box plot: calculate Q1, Q2 ,Q3 and the median using the appropriate formula.Consider the following ordered data.12 15 15 16 17 17 18 19 20 (a) Find the low, Q1, median, Q3, and high (b) Find the interquartile range.An agent for a property management company would like to be able to predict the monthly rental cost for apartments based on the size of the apartment as defined by square footage. A sample of the rent of 25 apartments in a college rental neighborhood was selected, and the information collected revealed the following: Apartment Size (Sq. Ft.) Monthly Rent ($) 1 850 950 2 1,450 1,600 3 1,085 1,200 4 1,232 1,500 5 718 950 6 1,485 1,700 7 1,136 1,650 8 726 935 9 700 875 10 956 1,150 11 1,100 1,400 12 1,285 1,650 13 1,985 2,300 14 1,369 1,800 15 1,175 1,400 16 1,225 1,450 17 1,245 1,100 18 1,259 1,700 19 1,150 1,200 20 896 1,150 21 1,361 1,600 22 1,040 1,650 23 755 1,200 24 1,000 800 25 1,200 1,750 e) Determine the coefficient of determination r2 and then completely interpret…
- An agent for a property management company would like to be able to predict the monthly rental cost for apartments based on the size of the apartment as defined by square footage. A sample of the rent of 25 apartments in a college rental neighborhood was selected, and the information collected revealed the following: Apartment Size (Sq. Ft.) Monthly Rent ($) 1 850 950 2 1,450 1,600 3 1,085 1,200 4 1,232 1,500 5 718 950 6 1,485 1,700 7 1,136 1,650 8 726 935 9 700 875 10 956 1,150 11 1,100 1,400 12 1,285 1,650 13 1,985 2,300 14 1,369 1,800 15 1,175 1,400 16 1,225 1,450 17 1,245 1,100 18 1,259 1,700 19 1,150 1,200 20 896 1,150 21 1,361 1,600 22 1,040 1,650 23 755 1,200 24 1,000 800 25 1,200 1,750 i) Determine a 95% interval estimate for the average rent of apartments with 1000…Consider the following Box plots for data set A and data set B. Which data set has the smallest valueDraw the box-and-whisker plot and give the five-number summary for each data set. Number of games won by the Detroit Lions in their last 10 seasons: minumim:________ (9,7,11,7,4,10,6,2,0,7) Lower Quartile:________ Median:______________ Upper Quartile:_____________ Maximum_______________
