Not long ago, Car and Driver magazine ran several sports cars as fast as they could down a 1-mile runway. The data they collected on one of the cars (a Dodge Viper SRT-10) is shown below. time (sec) speed (mph) 4.4 60 9.6 100


Correlation
Correlation defines a relationship between two independent variables. It tells the degree to which variables move in relation to each other. When two sets of data are related to each other, there is a correlation between them.
Linear Correlation
A correlation is used to determine the relationships between numerical and categorical variables. In other words, it is an indicator of how things are connected to one another. The correlation analysis is the study of how variables are related.
Regression Analysis
Regression analysis is a statistical method in which it estimates the relationship between a dependent variable and one or more independent variable. In simple terms dependent variable is called as outcome variable and independent variable is called as predictors. Regression analysis is one of the methods to find the trends in data. The independent variable used in Regression analysis is named Predictor variable. It offers data of an associated dependent variable regarding a particular outcome.
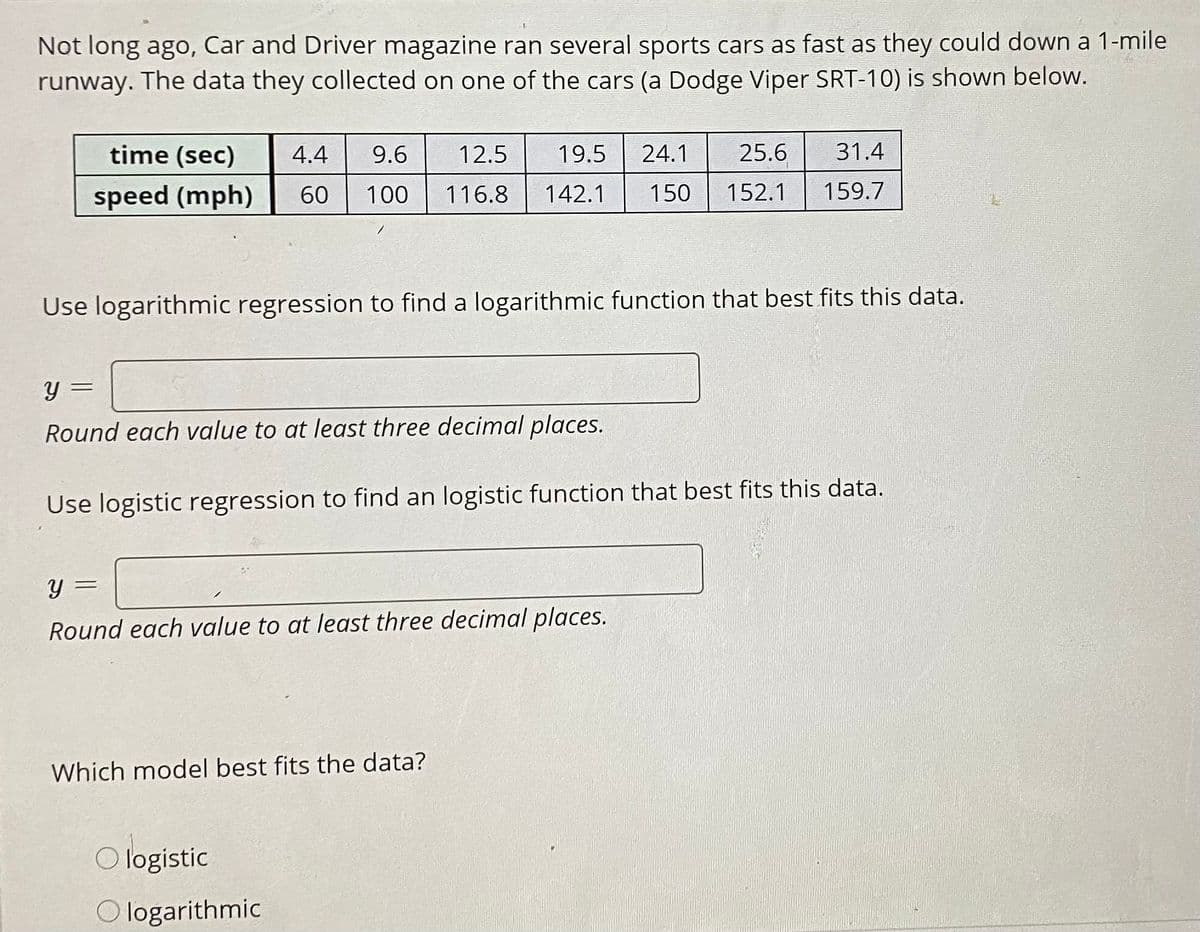
Not long ago, Car and Driver magazine ran several sports cars as fast as they could down a 1-mile runway. The data they collected on one of the cars (a Dodge Viper SRT-10) is shown below.
time (sec) speed (mph)
4.4 60
9.6 100
12.5 116.8
19.5 142.1
24.1 150
25.6 152.1
31.4 159.7
Use logarithmic regression to find a logarithmic
y=
Use logistic regression to find an logistic function that best fits this data. (Round each value to at least three decimal places.)
y=
Which model best fits the data?
- logistic
- logarithmic


Trending now
This is a popular solution!

Step by step
Solved in 4 steps with 3 images


