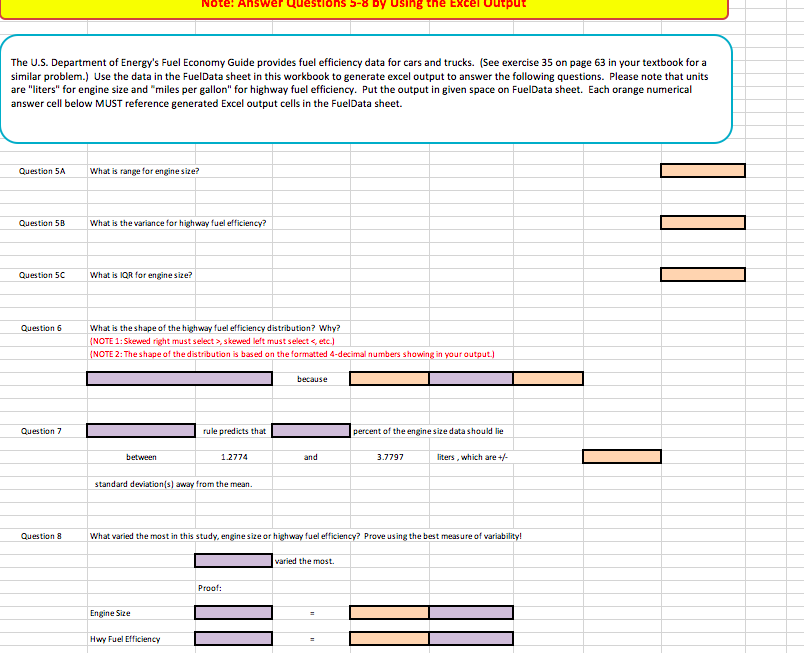
Note: Ahswer Questions S-8 Dy Using the Excel output The U.S. Department of Energy's Fuel Economy Guide provides fuel efficiency data for cars and trucks. (See exercise 35 on page 63 in your textbook for a similar problem.) Use the data in the FuelData sheet in this workbook to generate excel output to answer the following questions. Please note that units are "liters" for engine size and "miles per gallon" for highway fuel efficiency. Put the output in given space on FuelData sheet. Each orange numerical answer cell below MUST reference generated Excel output cells in the FuelData sheet. Question 5A What is range for enginesize? Question 5B What is the variance for highway fuel efficiency? Question 5C What is IQR for enginesize? Question 6 What is the shape of the highway fuel efficiency distribution? Why? NOTE 1:Skewed fight must select>,s kewed left must select < NOTE 2: The shape of the distribution is based on the formatted 4-decimal numbers showing in your output because Question 7 rule predicts that percent of the enginesize datashould lie between 12774 and 3.7797 liters, which are+ standard deviation s) away from the mean. Question 8 What varied the most in this study,engine size or highway fuel efficiency? Prove using the best measure of variability varied the most. Proof: Engine Size Hwy Fuel Efficiency


Inverse Normal Distribution
The method used for finding the corresponding z-critical value in a normal distribution using the known probability is said to be an inverse normal distribution. The inverse normal distribution is a continuous probability distribution with a family of two parameters.
Mean, Median, Mode
It is a descriptive summary of a data set. It can be defined by using some of the measures. The central tendencies do not provide information regarding individual data from the dataset. However, they give a summary of the data set. The central tendency or measure of central tendency is a central or typical value for a probability distribution.
Z-Scores
A z-score is a unit of measurement used in statistics to describe the position of a raw score in terms of its distance from the mean, measured with reference to standard deviation from the mean. Z-scores are useful in statistics because they allow comparison between two scores that belong to different normal distributions.
Engine Size Hwy Fuel Efficiency
2.60 29.45
1.50 27.10
1.60 30.63
3.30 36.52
2.60 45.95
3.20 42.41
3.00 35.35
2.00 36.52
2.20 34.17
1.60 31.81
1.80 32.99
1.70 35.35
2.40 32.99
2.60 31.81
3.40 24.74
1.90 24.74
2.20 27.10
3.10 25.92
1.70 29.45
2.80 31.81
2.20 43.59
2.70 47.13
2.10 41.24
3.10 35.35
3.40 30.63
2.40 29.45
3.40 37.70
2.30 25.92
3.20 29.45
3.10 24.74
2.00 40.06
3.00 44.77
3.40 35.35
2.10 32.99
2.50 38.88
3.00 34.17
3.10 32.99
2.50 31.81
2.90 27.10
1.50 27.10
1.50 37.70
1.40 34.17
2.60 28.28
3.30 27.10
2.30 40.06
3.20 42.41
2.20 34.17
2.80 31.81
1.70 41.24
3.30 38.88
3.30 35.35
3.40 37.70
3.30 28.28
1.90 28.28
3.20 41.24
1.80 27.10
3.30 36.52
2.40 36.52
3.30 34.17
2.40 32.99
1.90 34.17
1.40 40.06
3.10 25.92
2.20 36.52
1.80 28.28
3.30 41.24
2.40 45.95
2.50 31.81
2.30 37.70
2.40 38.88


Trending now
This is a popular solution!

Step by step
Solved in 8 steps with 7 images


