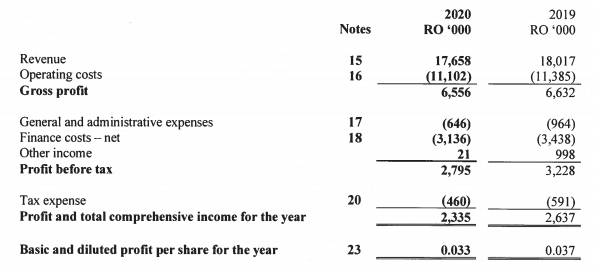
Notes RO '000 RO *000 Revenue Operating costs Gross profit 15 16 17,658 (11,102) 6,556 18,017 (11,385) 6,632 General and administrative expenses Finance costs - net 17 (646) (3,136) 21 2,795 (964) (3,438) 998 3,228 18 Other income Profit before tax Тах еxpense Profit and total comprehensive income for the year 20 _(460) 2,335 (591) 2,637 Basic and diluted profit per share for the year 23 0.033 0.037
Notes RO '000 RO *000 Revenue Operating costs Gross profit 15 16 17,658 (11,102) 6,556 18,017 (11,385) 6,632 General and administrative expenses Finance costs - net 17 (646) (3,136) 21 2,795 (964) (3,438) 998 3,228 18 Other income Profit before tax Тах еxpense Profit and total comprehensive income for the year 20 _(460) 2,335 (591) 2,637 Basic and diluted profit per share for the year 23 0.033 0.037

Essentials Of Investments
11th Edition
ISBN:9781260013924
Author:Bodie, Zvi, Kane, Alex, MARCUS, Alan J.
Publisher:Bodie, Zvi, Kane, Alex, MARCUS, Alan J.
Chapter1: Investments: Background And Issues
Section: Chapter Questions
Problem 1PS

Related questions
Question
Calculate the following Ratio:
Gross profit Ratio
Net profit Ratio
Transcribed Image Text:2020
2019
Notes
RO '000
RO '000
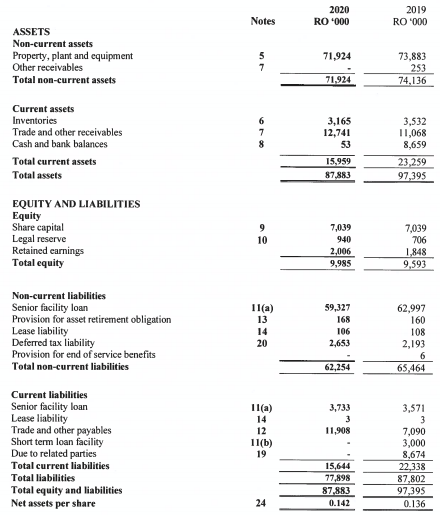
ASSETS
Non-current assets
Property, plant and equipment
Other receivables
5
71,924
73,883
253
74,136
Total non-current assets
71,924
Current assets
Inventories
Trade and other receivables
Cash and bank balances
3,165
12,741
3,532
I1,068
8,659
53
Total current assets
23,259
97,395
15,959
Total assets
87,883
EQUITY AND LIABILITIES
Equity
Share capital
Legal reserve
Retained earnings
Total equity
9
7,039
7,039
706
10
940
1,848
9,593
2,006
9,985
Non-current liabilities
Senior facility loan
Provision for asset retirement obligation
Lease liability
Deferred tax liability
Provision for end of service benefits
62,997
160
108
2,193
11(a)
59,327
13
168
14
106
20
2,653
Total non-current liabilities
62,254
65,464
Current liabilities
Senior facility loan
Lease liability
Trade and other payables
Short term loan facility
Due to related parties
1l(a)
3,733
3,571
14
3
3
12
11,908
7,090
3,000
8,674
22,338
87,802
97,395
0.136
11(b)
19
Total current liabilities
15,644
77,898
87,883
0.142
Total liabilities
Total equity and liabilities
Net assets per share
24
Transcribed Image Text:2020
2019
Notes
RO *000
RO *000
17,658
(11,102)
6,556
Revenue
15
Operating costs
Gross profit
18,017
(11,385)
6,632
16
General and administrative expenses
Finance costs – net
17
(646)
(3,136)
21
2,795
(964)
(3,438)
998
18
Other income
Profit before tax
3,228
Тах еxpense
Profit and total comprehensive income for the year
(460)
2,335
20
(591)
2,637
Basic and diluted profit per share for the year
23
0.033
0.037
Expert Solution
This question has been solved!
Explore an expertly crafted, step-by-step solution for a thorough understanding of key concepts.

Step by step
Solved in 3 steps

Knowledge Booster


Learn more about
Need a deep-dive on the concept behind this application? Look no further. Learn more about this topic, finance and related others by exploring similar questions and additional content below.Recommended textbooks for you
Essentials Of Investments
Finance
ISBN:
9781260013924
Author:
Bodie, Zvi, Kane, Alex, MARCUS, Alan J.
Publisher:
Mcgraw-hill Education,


Essentials Of Investments
Finance
ISBN:
9781260013924
Author:
Bodie, Zvi, Kane, Alex, MARCUS, Alan J.
Publisher:
Mcgraw-hill Education,

Foundations Of Finance
Finance
ISBN:
9780134897264
Author:
KEOWN, Arthur J., Martin, John D., PETTY, J. William
Publisher:
Pearson,

Fundamentals of Financial Management (MindTap Cou…
Finance
ISBN:
9781337395250
Author:
Eugene F. Brigham, Joel F. Houston
Publisher:
Cengage Learning

Corporate Finance (The Mcgraw-hill/Irwin Series i…
Finance
ISBN:
9780077861759
Author:
Stephen A. Ross Franco Modigliani Professor of Financial Economics Professor, Randolph W Westerfield Robert R. Dockson Deans Chair in Bus. Admin., Jeffrey Jaffe, Bradford D Jordan Professor
Publisher:
McGraw-Hill Education