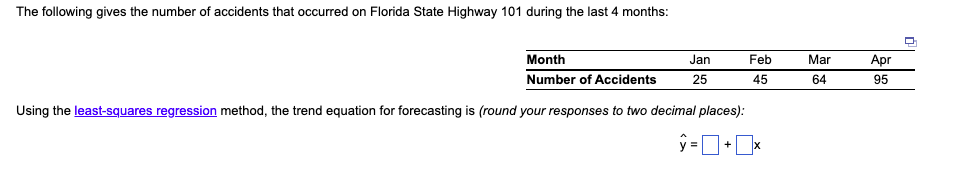
Number of Accidents 25 45 64 95 Using the least-squares regression method, the trend equation for forecasting is (round your responses to two decimal places):


Q: Write down the constrained optimization problem as a function of the Objective Function. Then, on a…
A: Linear programming is a mathematical technique that is also used in operations management…
Q: determine the minimum total annual inventory cost
A: Inventory cost is the cost covering the cost to order and the holding inventory. This cost is…
Q: Sunseel Industries produces two types of raw materials, A and B, with a production cost of $4 and $8…
A:
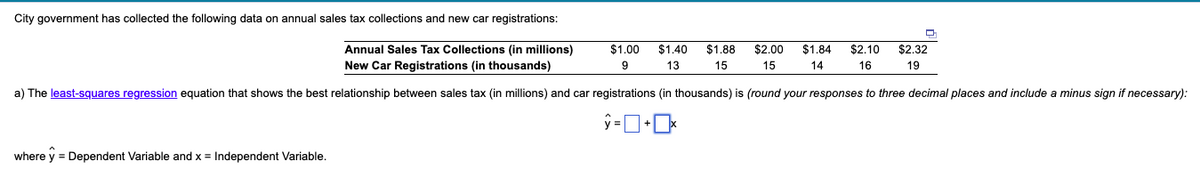
Q: Given the data below, what is the simple linear regression model that can be used to predict sales…
A: The connection among two quantitative variables is estimated using simple linear regression. We can…
Q: A one-day vaccination clinic has forecast the number of workers needed according to the table shown…
A: A worker in 10 hour shift can start from either 8 am or 10 am because after 10 am shift, the 10 hour…
Q: It costs $2 to move 1 workpiece 1 foot. What is the cost?
A: Production is the process of converting inputs into outputs. During production, there are various…
Q: 3. Atlas Fertz Corp. makes a fertilizer using two chemicals that provide nitrogen, phosphate, and…
A: Part (A): Decision Variable: Suppose - X1 be the no. of kilograms of ingredient 1 chemical…
Q: Consider following data. Draw activity on arc (AOA) network diagram. Find out critical path,…
A: Critical path tells the shortest duration of the project.
Q: What are the buyer-supplier relationships and which one is most likely used by Unilever
A: The management of the flow of products and services comprises all the approaches that change or…
Q: Uberya Towing Services repair vehicles that break down at an average 8 vehicles per day. The…
A: Service rate is the rate at which the customers are being solved by the worker in an organisation.
Q: A company that manufactures cars would use about 50,000 steering wheels per year Such steering wheel…
A: Given data is Annual demand(D) = 50,000 wheels Order cost(S) = P1,250.00 Holding cost(H) = 40% of…
Q: tuation 1. Mr. Patty Fat is the human resource supervisor of Cornee Corporation, producer of a…
A: Situation1: As a supervisor, how will you decide on this situation? What considerations are needed…
Q: LahLa Mub Delivery a logistics operator process the packages for shipment. The items arrive at the…
A: Service rate is the rate at which the customers are being served by the workers in an organisation.
Q: Suppose you are thinking of starting a new business. You will need to give up your current job that…
A: Opportunity cost is the cost of the next best alternative which is required to be given up in order…
Q: Question: 2 THE FOLLOWING QUESTIONS WILL BE ANSWERED BY TAKING INTO CONSIDERATION THE TABLE VALUES…
A: a) According to Lindo screen output, X1 = 170, X2 = 0, X3 = 30, X4 = 50…
Q: Describe how an organization can use a social media site such as LinkedIn to hire the best people
A: Since you have asked multiple questions, we will solve the first question for you. If you want any…
Q: Below are the production demands for the first four months of the year. What is the 4 month moving…
A: Forecasting is the process of estimating future demand based on previous or historic data and…
Q: What kind of impact, if any, does the use of project cost management strategies such as expert…
A: Project cost management is a critical success factor in any project. It means making informed…
Q: Q2: The activities involved in the construction of a certain project are given in the table below.…
A:
Q: 4.3 If you were to play a simulation game next term, also in a group, what would you do differently?
A: Nowadays Simulation Games have become a significant instrument of management curriculum along with…
Q: To begin, what is a performance test? And what are the bottlenecks in performance testing?
A: A performance test is conducted to find out the evaluations of the a system in order to measure the…
Q: (3) What are the basic steps in risk management? Briefly describe each.
A: 3. Risk management process involves risk identification, risk analysis, risk response planning and…
Q: How many containers should be authorized for January? 22 containers. (Enter your response rounded up…
A: Given: Average demand d 4200 Average waiting time per unit w 0.5 Average processing time per…
Q: In process improvement efforts, cost of quality is a means to quantify the total cost of…
A: The following are some probable causes of high quality-related costs: 1. Poor quality leads in…
Q: a. Find the naïve forecast. b. Use the 3 years moving average forecast. c. Have a 5 years weighted…
A: Forecasting is predicting in advance the future sales based on the past data.
Q: How should Timothy Jose handle the problem?
A: The EEOC investigates charges brought against firms regarding discrimination against workers / job…
Q: What does the term "project" mean?
A: A project is a collection of tasks that must be accomplished in order to reach a certain objective…
Q: Using the information contained in the table shown, do each of the following: 1. Draw a precedence…
A: As per our guidelines, we are supposed to answer only three sub-parts if multiple sub-parts are…
Q: a) Determine cost ol the current layoul, Plin A, Irom the dala above. b) One alternative is to…
A: Cost of layout = Total of (Workpieces moved * Distance between work areas* Cost of moving…
Q: Differentiate between speculative and event risks.
A: Risk management can be stated as the approach of recognizing, evaluating, and handling or…
Q: LahLa Mub Delivery a logistics operator process the packages for shipment. The items arrive at the…
A: ARRIVAL TIME = 50 PER HOUR SERVICE TIME = 1 PER MINUTE
Q: In what ways might working on a unique project inside one's company improve one's career? Risks…
A: Working on any project comes with some inherent risks. There is always the chance that the project…
Q: • Q3: Draw the network diagram and determine the critical path for the following project: Activity…
A: The path having the longest duration is Critical Path. A path in a project network is called…
Q: ABC company, a textile manufacturing company, has recorded defects in their production for a month…
A: Given: Defect FREQ Misprinting 55 Shade Variation 38 Uneven Dyeing 10 Drop Stitching 5…
Q: Explain in detail the sources of variability in a supply chain (5 sources)
A: Variability is a phrase used in the Supply Chain to define the amount of irregularity, or…
Q: Fitness Now and Forever Fit are monthly publications that target companies in the fitness industry.…
A: The correct option is Content.
Q: What makes the store manager of a retail company a classic example of an operations manager?
A: Operations managers are responsible for the operations of a company on a day-to-day basis. They…
Q: The Fly-Right Airplane Company builds small jet airplanes to sell to corporationsfor the use of…
A: a.
Q: How does revenue management impact an aggregate plan?
A: The revenue management process can be broken down into two components: aggregate planning and price…
Q: Centralised purchasing and supply organisational structure 2. Decentralised purchasingand supply…
A: Here, there are three kinds of purchasing, these are centralized purchasing, decentralized…
Q: 3. JRT Industries manufactures automatic voltage regulators at a labor cost of P 85 material cost of…
A: Break even point is the point at which the production cost and production revenue are equal in an…
Q: You are the HR Manager for a consulting company that creates training materials for Fortune 500…
A: Leadership is all about guiding and motivating the employees in an organization. A leader must…
Q: What is the duration of the project? Identify the critical path. How many days can ACTIVITY C be…
A: “Since you have posted a question with multiple sub-parts, we will solve first three sub-parts for…
Q: The total subcontracting cost = $ (Enter your response as a whole number.) The total inventory…
A: Project cost is the funds that are required to complete the proect and work it smoothly financially.…
Q: 2. The OPTIMIS factory produces cars, with the body assembly time requirements for two types of cars…
A: Linear programming is a mathematical technique that is also used in operations management…
Q: Ram Roy's firm has developed the following supply, demand, cost, and inventory data. Supply…
A: Formulate a spreadsheet and find the optimal solution using excel solver as shown below: Note: NWCM…
Q: How significant is the role that software plays in the quality of products these days?
A: Nowadays using software is getting very common. Every business either small or big is using one or…
Q: To what extent do agile and predictive techniques aim to fulfill the project client's needs?
A: Agile technology refers to managing a project by breaking the overall project in numerous stages.…
Q: olving quality-related problems in the organisation is as much about applying the tools and…
A: Organizational problem solving is about more than just applying the right tools and techniques. It's…
Q: Which of the following statements is true regarding the sensitivity analysis approach to investment…
A: Sensitivity analysis is a risk assessment techniques of capital budgeting. Sensitivity analysis is…
1

Step by step
Solved in 2 steps with 2 images

- The owner of a restaurant in Bloomington, Indiana, has recorded sales data for the past 19 years. He has also recorded data on potentially relevant variables. The data are listed in the file P13_17.xlsx. a. Estimate a simple regression equation involving annual sales (the dependent variable) and the size of the population residing within 10 miles of the restaurant (the explanatory variable). Interpret R-square for this regression. b. Add another explanatory variableannual advertising expendituresto the regression equation in part a. Estimate and interpret this expanded equation. How does the R-square value for this multiple regression equation compare to that of the simple regression equation estimated in part a? Explain any difference between the two R-square values. How can you use the adjusted R-squares for a comparison of the two equations? c. Add one more explanatory variable to the multiple regression equation estimated in part b. In particular, estimate and interpret the coefficients of a multiple regression equation that includes the previous years advertising expenditure. How does the inclusion of this third explanatory variable affect the R-square, compared to the corresponding values for the equation of part b? Explain any changes in this value. What does the adjusted R-square for the new equation tell you?The Baker Company wants to develop a budget to predict how overhead costs vary with activity levels. Management is trying to decide whether direct labor hours (DLH) or units produced is the better measure of activity for the firm. Monthly data for the preceding 24 months appear in the file P13_40.xlsx. Use regression analysis to determine which measure, DLH or Units (or both), should be used for the budget. How would the regression equation be used to obtain the budget for the firms overhead costs?Do the sales prices of houses in a given community vary systematically with their sizes (as measured in square feet)? Answer this question by estimating a simple regression equation where the sales price of the house is the dependent variable, and the size of the house is the explanatory variable. Use the sample data given in P13_06.xlsx. Interpret your estimated equation, the associated R-square value, and the associated standard error of estimate.
- A small computer chip manufacturer wants to forecast monthly ozperating costs as a function of the number of units produced during a month. The company has collected the 16 months of data in the file P13_34.xlsx. a. Determine an equation that can be used to predict monthly production costs from units produced. Are there any outliers? b. How could the regression line obtained in part a be used to determine whether the company was efficient or inefficient during any particular month?The management of a technology company is trying to determine the variable that best explains the variation of employee salaries using a sample of 52 full-time employees; see the file P13_08.xlsx. Estimate simple linear regression equations to identify which of the following has the strongest linear relationship with annual salary: the employees gender, age, number of years of relevant work experience prior to employment at the company, number of years of employment at the company, or number of years of post secondary education. Provide support for your conclusion.Suppose that a regional express delivery service company wants to estimate the cost of shipping a package (Y) as a function of cargo type, where cargo type includes the following possibilities: fragile, semifragile, and durable. Costs for 15 randomly chosen packages of approximately the same weight and same distance shipped, but of different cargo types, are provided in the file P13_16.xlsx. a. Estimate a regression equation using the given sample data, and interpret the estimated regression coefficients. b. According to the estimated regression equation, which cargo type is the most costly to ship? Which cargo type is the least costly to ship? c. How well does the estimated equation fit the given sample data? How might the fit be improved? d. Given the estimated regression equation, predict the cost of shipping a package with semifragile cargo.
- The file P13_42.xlsx contains monthly data on consumer revolving credit (in millions of dollars) through credit unions. a. Use these data to forecast consumer revolving credit through credit unions for the next 12 months. Do it in two ways. First, fit an exponential trend to the series. Second, use Holts method with optimized smoothing constants. b. Which of these two methods appears to provide the best forecasts? Answer by comparing their MAPE values.The file P13_29.xlsx contains monthly time series data for total U.S. retail sales of building materials (which includes retail sales of building materials, hardware and garden supply stores, and mobile home dealers). a. Is seasonality present in these data? If so, characterize the seasonality pattern. b. Use Winters method to forecast this series with smoothing constants = = 0.1 and = 0.3. Does the forecast series seem to track the seasonal pattern well? What are your forecasts for the next 12 months?The file P13_02.xlsx contains five years of monthly data on sales (number of units sold) for a particular company. The company suspects that except for random noise, its sales are growing by a constant percentage each month and will continue to do so for at least the near future. a. Explain briefly whether the plot of the series visually supports the companys suspicion. b. By what percentage are sales increasing each month? c. What is the MAPE for the forecast model in part b? In words, what does it measure? Considering its magnitude, does the model seem to be doing a good job? d. In words, how does the model make forecasts for future months? Specifically, given the forecast value for the last month in the data set, what simple arithmetic could you use to obtain forecasts for the next few months?
- The file P13_26.xlsx contains the monthly number of airline tickets sold by the CareFree Travel Agency. a. Create a time series chart of the data. Based on what you see, which of the exponential smoothing models do you think will provide the best forecasting model? Why? b. Use simple exponential smoothing to forecast these data, using a smoothing constant of 0.1. c. Repeat part b, but search for the smoothing constant that makes RMSE as small as possible. Does it make much of an improvement over the model in part b?The file P13_22.xlsx contains total monthly U.S. retail sales data. While holding out the final six months of observations for validation purposes, use the method of moving averages with a carefully chosen span to forecast U.S. retail sales in the next year. Comment on the performance of your model. What makes this time series more challenging to forecast?The file P13_28.xlsx contains monthly retail sales of U.S. liquor stores. a. Is seasonality present in these data? If so, characterize the seasonality pattern. b. Use Winters method to forecast this series with smoothing constants = = 0.1 and = 0.3. Does the forecast series seem to track the seasonal pattern well? What are your forecasts for the next 12 months?

