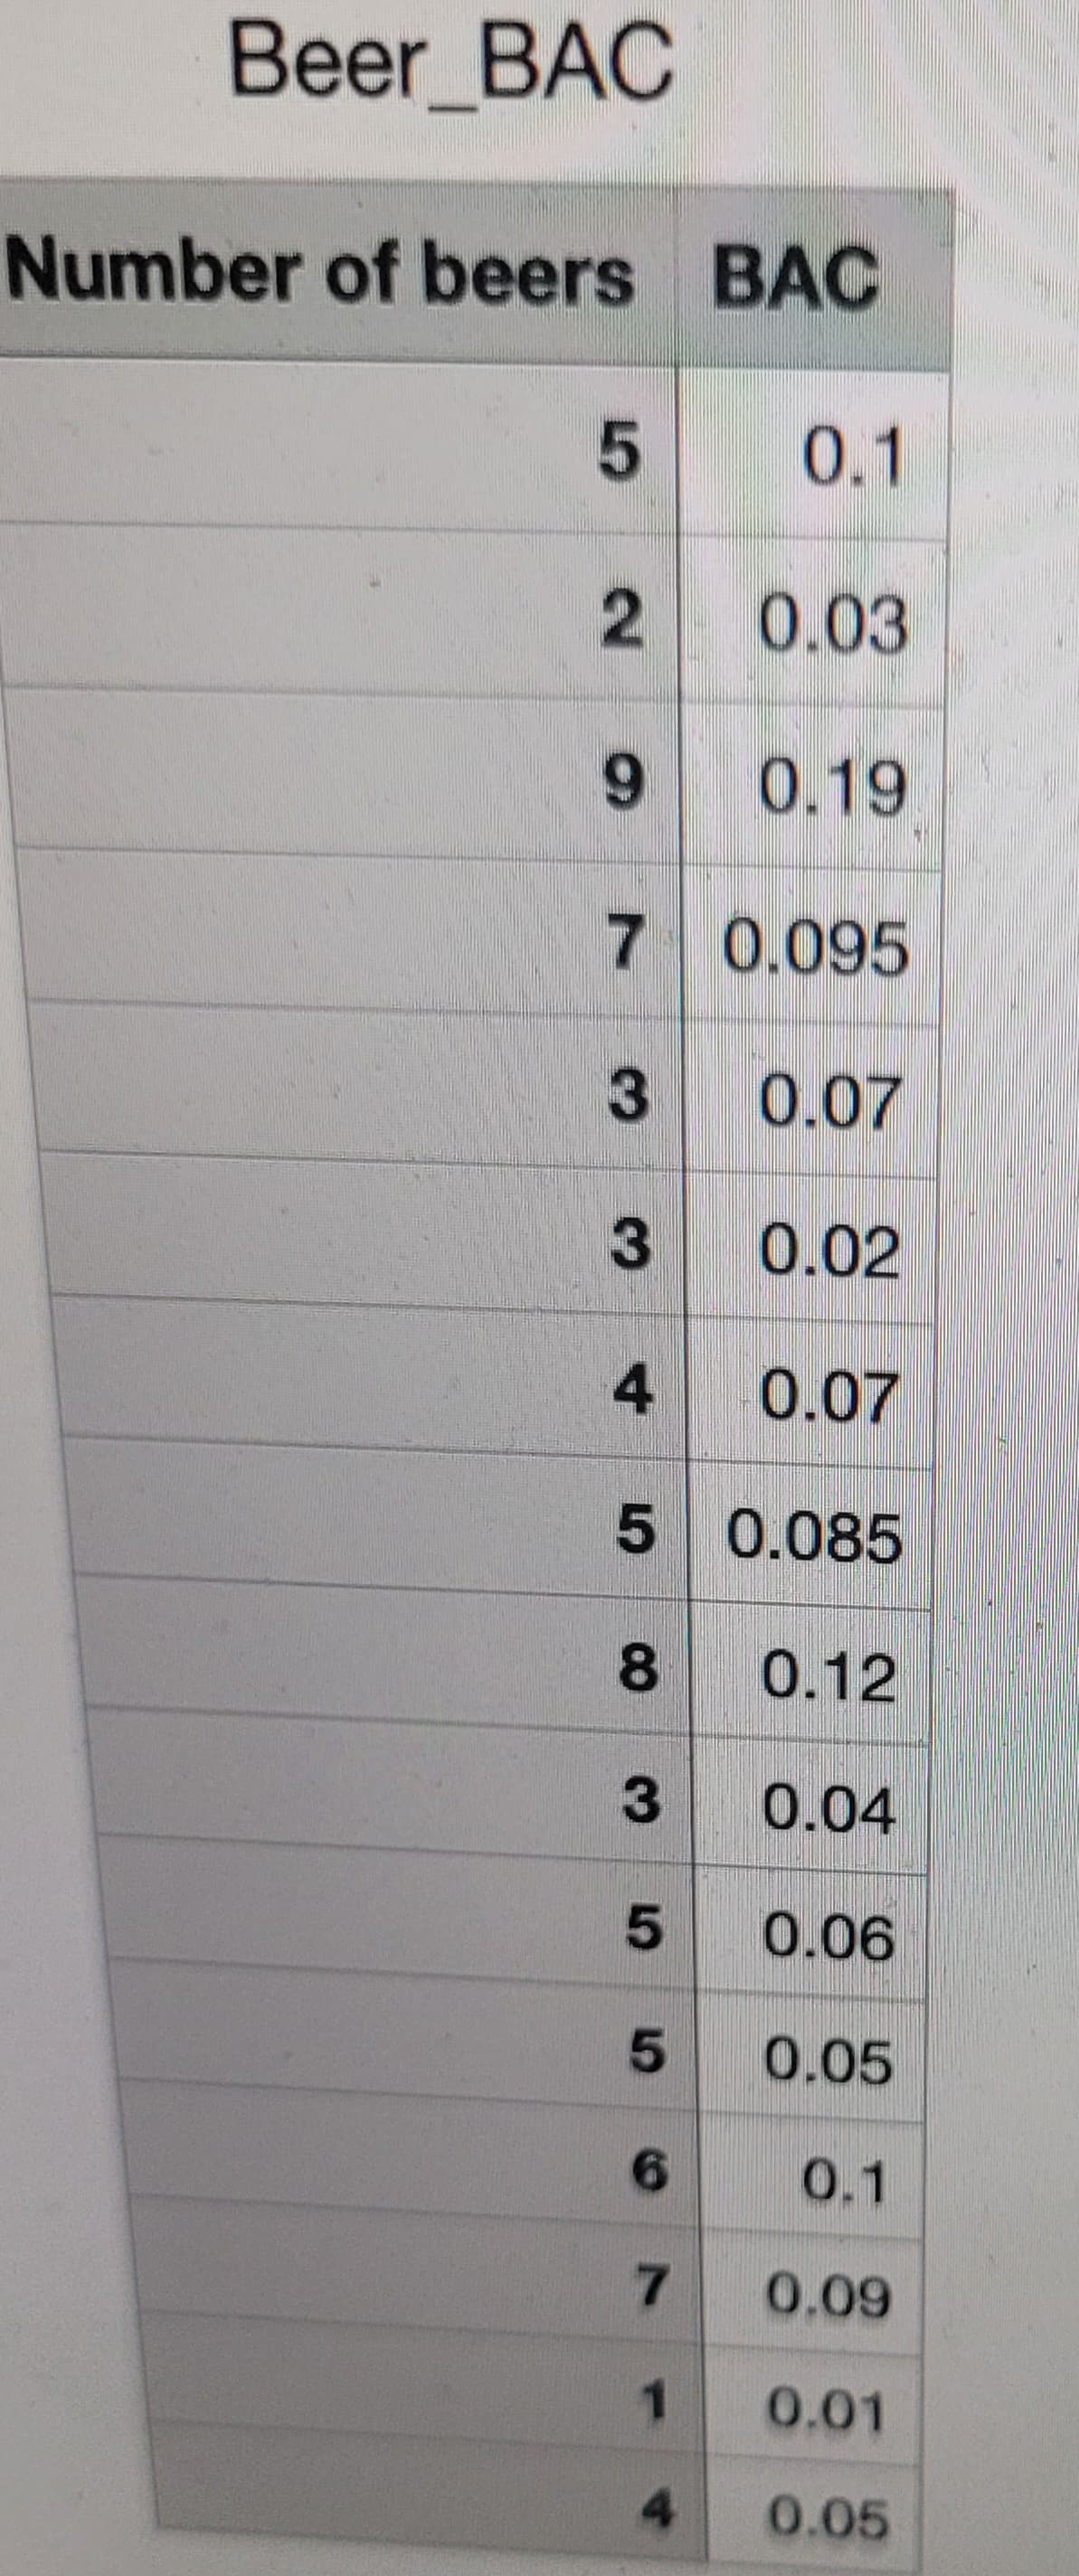
Number of beers BAC 5 0.1 2 0.03 9 0.19 7 0.095 3 0.07 3 0.02 0.07 0.085 0.12 0.04 0.06 0.05 0.1 0.09 0.01 0.05 4 5 8 3 5 5 6 7 1 4


Q: Suppose that random variables X, and X₂ have exponential distribution with expected value of and…
A:
Q: ✪ 2 0 Find the area of the shaded region. The graph to the right depicts IQ scores of adults, and…
A:
Q: 3. A random sample of 25 observations taken from a population that is normally distributed produced…
A:
Q: able below presents the lifetimes of 200 inca Item
A: The first step is to compute the minimum and maximum values of the datasets. We get that:…
Q: Executives at a car dealership want to estimate the average age of their custome before making a…
A: Margin of error
Q: Use the data in the following table, which lists drive-thru order accuracy at popular fast food…
A:
Q: Determine the area of under the Normal Curve for 2≤-1.1. -1.1 area=[a]
A: Let Z be the random variable from Normal distribution then we will find the area under normal curve…
Q: ow many ways can the positions of center midfielder, striker, and center back be assigned from the…
A: In a soccer team of 10, there will be 2 strikers, 2 mid fielders and 2 center backs.
Q: Compute the following binomial probabilities directly from the formula for b(x; n, p). (Round your…
A: From the provided information, Number of trials (n) = 8 Number of success (x) = 5 Probability of…
Q: LONstruct the 90% confidence interval for the difference P₁ P₂ when x₁ = 45, n₁ = 85, x₂ = 20, and…
A: We have given that, X1 = 45, n1 = 85 and X2 = 20, n2 = 65 Then, We will find the 90% confidence…
Q: Executives at a music label surveyed 125 people who actively download music and found that the…
A:
Q: Company A claims that 75% of their customers are very satisfied with the service they receive. To…
A: It is given that Sample size n = 600 Number of satisfied customers X = 430 Level of significance =…
Q: Data on pull-off force (pounds) for connectors used in an automobile engine application are as…
A: Disclaimer : “Since you have posted a question with multiple sub-parts, we will solve first three…
Q: 9. Let W be distributed as the binomial with parameters n and p. Two estimators proposed for p are W…
A:
Q: Suppose that an experimenter tossed three balanced coins. He defined X₁, to denote the number of…
A:
Q: If the t-test statistic for a single t-test is 1.58, what can you conclude? A) The test is…
A: It is given that the t-test statistic is 1.58. a. Here, the degrees of freedom or sample size are…
Q: If X is a continuous random variable, what is the value of X that will be exceeded 30% of the time,…
A: Solution: From the given information, X follows gamma distribution with mean of 2 and a variance of…
Q: Based on the records of the Admissions Office of University U, the mean score of all Grade 12…
A:
Q: High Cholesterol: A group of eight individuals with high cholesterol levels were given a new drug…
A: For the given data Perform paired t test
Q: 4. In an experiment on extrasensory perception (ESP), a subject in one room is asked to state the…
A: Disclaimer : "Since you have asked multiple question, we will solve the first question for you. If…
Q: What calculator button would be used to perform a hypothesis test if the null and alternative…
A:
Q: Data on pull-off force (pounds) for connectors used in an automobile engine application are as…
A:
Q: If we sample from a small finite population without replacement, the binomial distribution should…
A: In question, Given formula of probability of hypergeometric distribution with unknown constant. Then…
Q: The mean serum-creatinine level measured in 12 patients 24 hours after they received a newly…
A: Note: As per the company guidelines only 3 subparts can be answered. Kindly, resubmit the question…
Q: Part 3 Confidence level=99.9%, degrees of freedom=24
A:
Q: Nine pairs of data yield a regression equation of y=0.93x + 19.4, with r= 0.967 and an average y…
A:
Q: A sample of the length in inches for newborns is given below. Assume that lengths are normally…
A: Given,sample…
Q: Let X denote the amount of time a book on two-hour reserve is actually checked out, and suppose the…
A: According to bartleby expert guidelines we can answer only first three subparts. Rest can be repost.
Q: When a scientist conducted a genetics experiments with peas, one sample of offspring consisted of…
A: If distribution has two possibility then they follow binomial distribution. It is a type of discrete…
Q: High Cholesterol levels were given a new drug that was designed to lower cholesterol levels.…
A: Given that Sample size n =5 Level of significance =0.05
Q: The following stem and leaf plot gives the scores on a statistics exam taken by industrial…
A: From the given stem and leaf plot, The data values are 90, 91, 94, 83, 85, 85, 87, 88, 72, 74, 74,…
Q: Develop a 95% confidence interval estimate of the mean amount spent per day by a family of four…
A: It is given that Sample size n = 64 Sample mean M = 252.45 Sample SD s = 74.50 The critical value of…
Q: given is the probability distrubution for a random variable X X -2 0…
A:
Q: Refer to the figure at the right. At a=0.10, can you support the claim that the proportion of men…
A: From the provided information,
Q: mpty. If your answer is "zero" enter "0". 68 35 63 33 21
A: In order to find the all the stems and associated leaves, it is useful to put the data in ascending…
Q: A random sample of 846 births included 433 boys. Use a 0.01 significance level to test the claim…
A: We have given that Hypothesized population proportion = 0.515 Favourable cases=433 Sample size =…
Q: after checking the hypothesis tests, please explain briefly how you should proceed given the result…
A: After testing the parametric assumptions tests, the researcher need to test the effects of factors…
Q: he following table is a probality distribution for a random variable X X -1 1…
A:
Q: Consider the following hypotheses: He: = 8 HA: 8 The population is normally distributed. A sample…
A: Given data is 6,9,8,7,7,11,10sample size(n)=7 H0:μ=8HA:μ≠8
Q: The display provided from technology available below results from using data for a smartphone…
A: Given that μ=5.00 Mbps Null hypothesis=H0 , Alternate hypothesis=H1
Q: Suppose that random variables X₁ and X₂ have exponential distribution with expected value and ,…
A: i. Given information: X1 and X2 are exponential distribution with expected value of 1/2 and 1/3. X1…
Q: 4. The point estimate for the proportion of 16-kbit dynamics RAMs that function correctly for at…
A:
Q: The pmf of the amount of memory X (GB) in a purchased flash drive is given as the following. X 1 2 4…
A: According to bartleby expert guidelines we can answer only first three subparts. Rest can be repost.
Q: A random sample of 16 individuals were given a test (scored out of 100 and is known to follow a…
A: Solution: Given information: k= 2 groups Each group has 16 observation n1=n2=16n=n1+n2n= 16+16=32…
Q: 1. Over the last several years, the use of cellphones has increased dramatically. An article in USA…
A: Given Talking time Sample size Mean Standard deviation Cell phone Men 100 372 120 Women…
Q: tha data below clearly indicates indicates the number of times a rain fall per week in Port…
A: no.of times rain fall / week 0 1 2 3 4 5 Rainfall chance 0.01 0.3 0.03 0.05 0.32 0.3
Q: A 1992 article in the Journal of the American Medical Association ("A Critical Appraisal of 98.6…
A:
Q: her information will be used in a work measurement analysis. The total ma W. 95 97 124 128 142 98…
A: num x 1 128 2 113 3 128 4 119 5 109 6 103 7 195 8 124 9 135 10 97 11 97 12…
Q: Determine the difference X - Y for each matched-pair, then compute the mean and standard deviation…
A: The solution and answer given below
Q: Suppose that and are unbiased estimators of the parameter 0. We know that V 2 estimator is the best?…
A: Best estimator among a group of unbiased estimator is one with less variance.
This uses minitab.
Make a regression that will enable you to predict BAC from the number of beers consumed. What is the predicted BAC for a person who has consumed 7 beers? Give your answer to 3 decimal places.


Trending now
This is a popular solution!

Step by step
Solved in 3 steps with 3 images

- A bank recieve average 6 bad cheks per a day what is probabilty that bank recieve 4 bad cheksDoritos chips are one of the most popular chips in the year 2020. Frito-Lay produces snack-sized bags of Doritos with 1.75-ounce bags. Unfortunately, Frito-Lay has received many complaints that the bags of chips lack the promised amount of chips. PepsiCo, the owner of Frito-Lay, decide to run an internal investigation of their Doritos chip production. They sample around 500 bags of chips to discover that they found an average of 1.59 ounces with a standard deviation of .12 ounces. Conduct a hypothesis test with an alpha-level of .05. Should they change their production of Doritos chips to match the 1.75 ounces on the bag?Estimate the percentage of the U.S. population that reacts negatively to the Confederate flag.a. less than 10 percentb. between 10 – 25 percentc. between 25 – 50 percentd. more than 50 percent Estimate the percentage of your peers (i.e., individuals in your age generation) that believe same-sex marriage should be legal.a. less than 10 percentb. between 10 – 25 percentc. between 25 – 50 percentd. more than 50 percent
- Fasteners are manufactured for an application involving aircraft. Each fastener is categorized either as conforming (suitable for its intended use), downgraded (unsuitable for its intended use but usable for another purpose), and scrap (not usable). It is thought that 85% of the fasteners are conforming, while 10% are downgraded and 5% are scrap. In a sample of 500 fasteners, 405 were conforming, 55 were downgraded, and 40 were scrap. Can you conclude that the true percentages differ from 85%, 10%, and 5%? a) State the appropriate null hypothesis. b) Compute the expected values under the null hypothesis. c) Compute the value of the chi-square statistic. d) Find the P-value. What do you conclude?Your place of employment is trying to determine whether to allow its employees to work from home for2 days a week. Knowing that you’ve previously taken a statistics course, your boss asks you to “figure itout”. You create a survey to gauge employee interest in this area.1. Formerly, your place of employment has tried to give surveys to everyone, a census, but only a fewpeople responded to the email. Your new plan is to randomly choose some employees and administerthe survey yourself. You put everyone’s name on a numbered list and randomly choose numbers untilyou have your sample. What form of sampling is being described here?2. Suppose you want to estimate the percentage of employees who want to work from home. Doingsome research on the internet, you find a recent study that found that 72% of employees prefer a hybridremote-office model. Using that value as your sample proportion, ?̂, estimate how many people youwould need to survey in order to estimate the percentage in your company…“PhysicalFun” is a physical center which opens 24 hours per day. Each member of “PhysicalFun” has anaccess card. Members would be charged in a weekly basic (Sunday 12:00a.m. to Saturday 11: 59 p.m.)according to the accumulated number of hours of facilities used within a week. The weekly basic charge is$150 with an additional charge of $30 per hour. According to the company record, the number of hours amember spends in “PhysicalFun” in a week is normally distributed with mean 15 hours and standard deviation2.8 hours.(a) What are the average and standard deviation of weekly charge of a member?(b) Suppose the middle 85% of weekly charge of a member is denoted by $(L1, L2). Find the values of L1and L2.(c) The senior management suggests fixing the weekly charge per member at $700. Assume the numberof hours a member spends in “PhysicalFun” would not be changed due to the change of the weekly chargecalculation method. What proportion of members would pay more money than the original…
- Imagine a database from the Gallogly College of Engineering that contained the starting salariesfor a sample of Spring 2021 graduating engineers. Recreate the following table. At theintersections of the table, fill out what happens to the sample statistic (in the row) when everysalary is altered by the specified amount (in the column). You’re welcome to use actual data totest your intuition, but data aren’t necessary – the answers in the intersections should begeneric.The state education commission wants to estimate the fraction of tenth grade students that have reading skills at or below the eighth grade level. Step 1 of 2: Suppose a sample of 333 tenth graders is drawn. Of the students sampled, 260 read above the eighth grade level. Using the data, estimate the proportion of tenth graders reading at or below the eighth grade level. Enter your answer as a fraction or a decimal number rounded to three decimal places. Step 2 of 2: Suppose a sample of 333 tenth graders is drawn. Of the students sampled, 260 read above the eighth grade level. Using the data, construct the 80% confidence interval for the population proportion of tenth graders reading at or below the eighth grade level. Round your answers to three decimal places.A study is run to evaluate the effectiveness of an exercise program in reducing systolic blood pressure in patients with pre-hypertension (defined as a systolic blood pressure between 120-139 mmHg or a diastolic blood pressure between 80-89 mmHg). A total of 7 patients with pre-hypertension enroll in the study, and their systolic blood pressures are measured. Each patient then participates in an exercise training program where they learn proper techniques and execution of a series of exercises. Patients are instructed to do the exercise program 3 times per week for 6 weeks. After 6 weeks, systolic blood pressures are again measured. The data are shown below. Is there is a difference in systolic blood pressures after participating in the exercise program as compared to before? State the hypotheses. What statistical test should be used to determine if there is a difference in systolic blood pressures before and after the exercise program? Determine the appropriate critical value and set…
- A substance abuse counselor wants to demonstrate the effect of situational stress on alcohol cravings. He recruits two groups of men who are similar in respect to history of alcohol use and demographic variables. He divides them in to two groups. In one group(n=11), the men are exposed to a stressful situation and then asked to complete a measure rating their alcohol cravings on a scale from 0-10, where 0 representsno cravings and 10 represents intense cravings. In the second group (n=10), the men are exposed to a neutral situation and asked to complete the same measure. What test and graph should I create to find out if a stressful situation result in more intense alcohol cravings than a non-stressful situation?A researcher is interested in attitudes towards releasing prisoners with Alzheimer's who have a life sentence. 85 randomly selected Americans were asked, "Prisoners with Alzheimer's who have a life sentence should be released: Strongly Agree, Agree, Disagree, Strongly Disagree". Match the vocabulary word with its corresponding example. All Americans The proportion of the 85 Americans surveyed who strongly agree that prisoners with life sentences who have Alzheimer's should be released Release: 'Strongly Agree' or 'Agree' or 'Disagree' or 'Strongly Disagree' The 85 Americans who participated in the survey The proportion of all Americans who strongly agree that prisoners with life sentences who have Alzheimer's should be released The list of answers that the 85 Americans gave. SamplePopulationVariableDataStatisticParameterA consumer-testing agency wants to evaluate the claim made by a manufacturer of discount tires. The manufacturer claims that its tires can be driven at least 35,000 miles before wearing out. To determine the average number of miles that can be obtained from the manufacturer’s tires, the agency randomly selects 60 tires from the manufacturer’s warehouse and places the tires on 15 cars driven by test drivers on a 2-mile oval track. The number of miles driven (in thousands of miles) until the tires are determined to be worn out is given in the following table. Car Miles Driven 1 25 2 27 3 35 4 42 5 28 6 37 7 40 8 31 9 29 10 33 11 30 12 26 13 31 14 28 15 30 Average 31.47 Standard 5.04 Agency would like to know if the manufacturer’s claim is false. Carryout an appropriate hypothesis test (use 1% significance level). Check any assumptions you think are relevant before doing the text.


