
Survey of Accounting (Accounting I)
8th Edition
ISBN:9781305961883
Author:Carl Warren
Publisher:Carl Warren
Chapter9: Metric-analysis Of Financial Statements
Section: Chapter Questions
Problem 9.4.4P: Twenty metrics of liquidity, solvency, and profitability The comparative financial statements of...

Related questions
Question
Determine the following measures for 20Y2, rounding to one decimal place including, percentage, except for per-share amounts.
5. Number of days sales in receivables
7. number of days sale in inventory
12.
14. return on common
17. dividends per share of common stock
18. dividend yield
i need help on these questions i have provided please please please
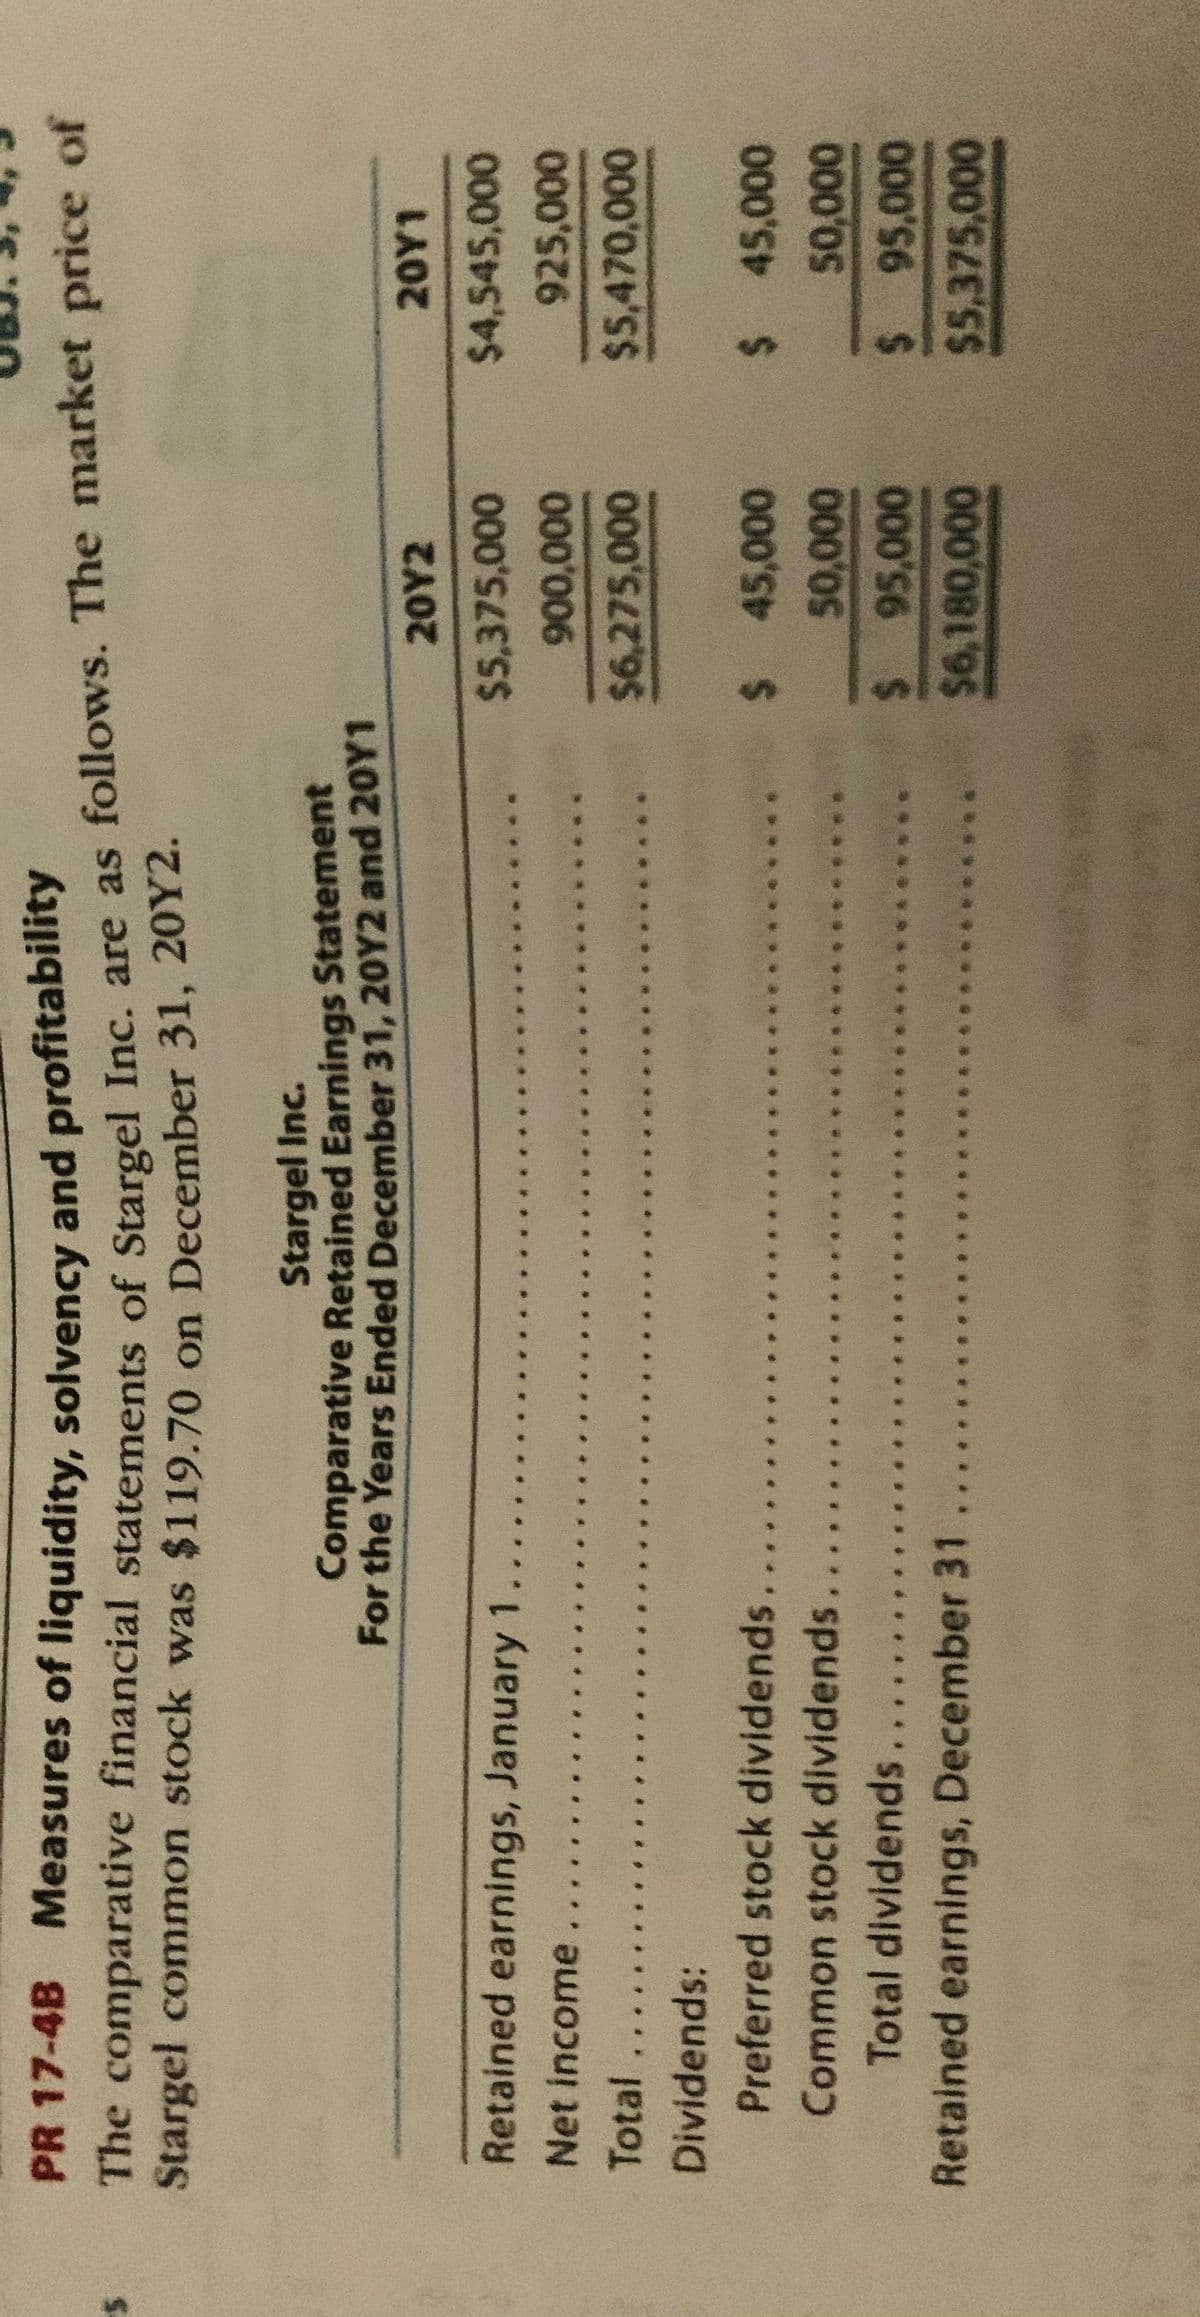
Transcribed Image Text:PR17-4B Measures of liquidity, solvency and profitability
The comparative financial statements of Stargel Inc. are as follows. The market price of
Stargel common stock was $119.70 on December 31, 20Y2.
Stargel Inc.
Comparative Retained Earnings Statement
For the Years Ended December 31, 20Y2 and 20Y1
20Y2
20Y1
Retained earnings, January 1
$5,375,000
%244,545,000
Net income
925,000
Total
$6,275,000
%245,470,000
Dividends:
Preferred stock dividends
%2 45,000
Common stock dividends
Total dividends
to 00
Retained earnings, December 31
$46,180,000
$5,375,000
..
Transcribed Image Text:877
percentages, except for per-share amounts:
For the Years Ended December 31, 20Y2 and 20Y1
Total liabilities and stockholders' equity......
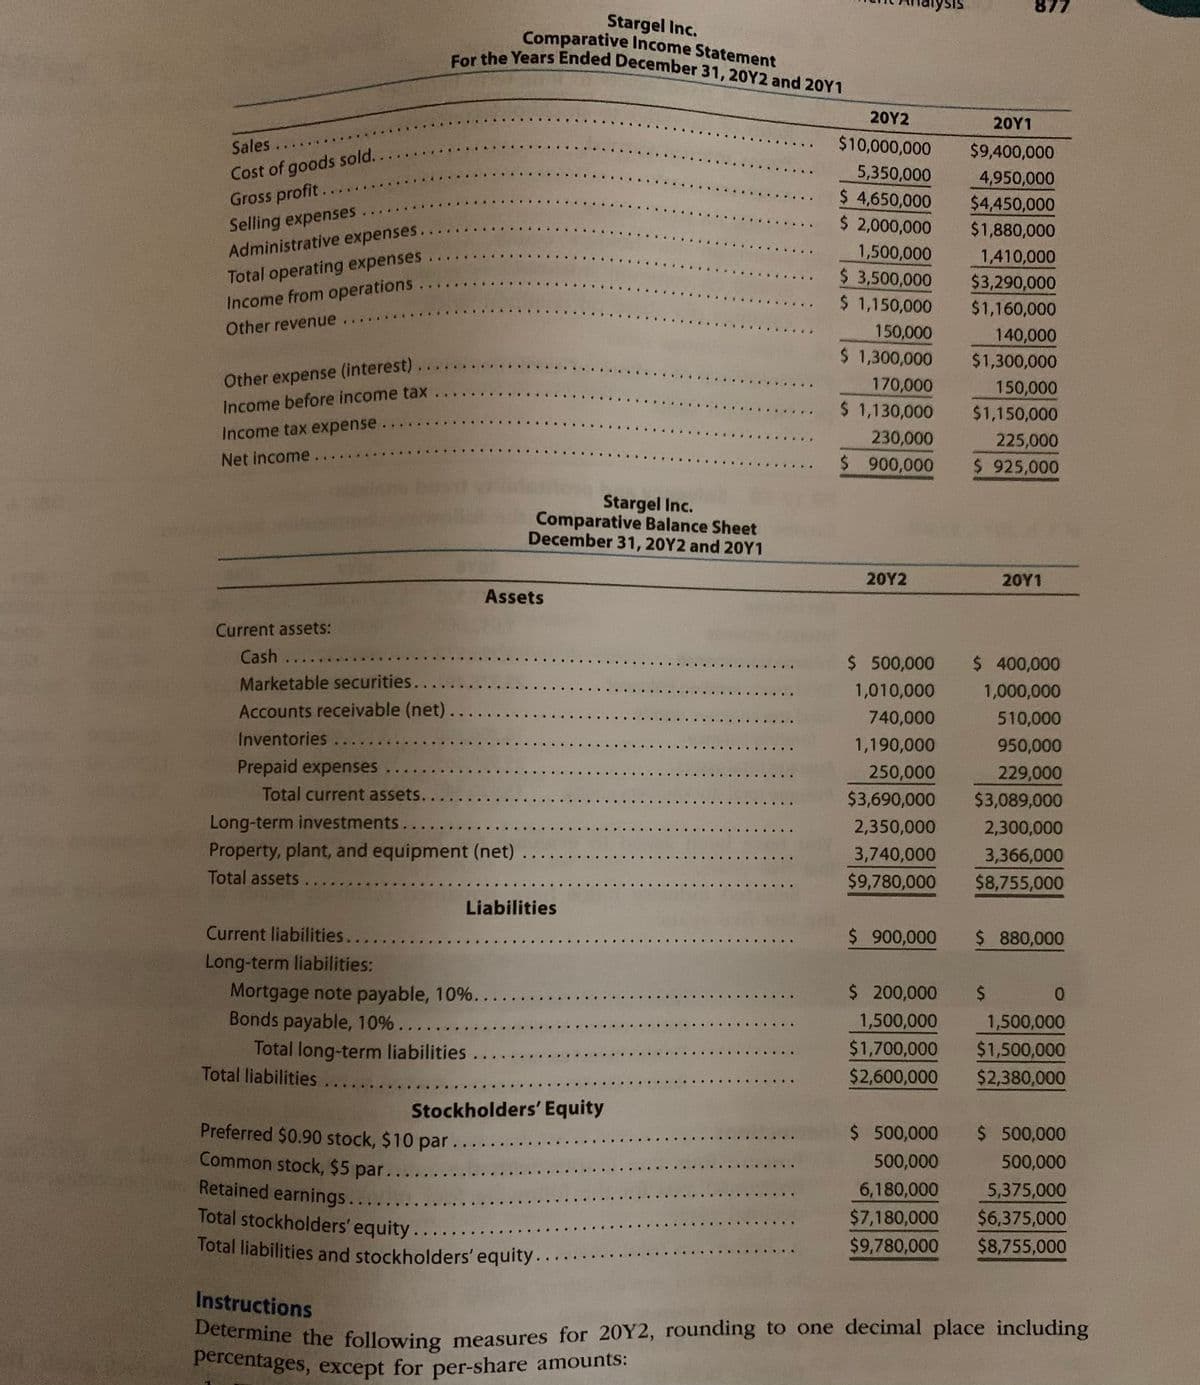
Stargel Inc.
Comparative Income Statement
20Υ2
20Υ1
Sales..
$10,000,000
$9,400,000
Cost of goods sold...
Gross profit...
Selling expenses...
Administrative expenses.
...
5,350,000
$ 4,650,000
$ 2,000,000
4,950,000
$4,450,000
$1,880,000
Total operating expenses...
Income from operations.
Other revenue..
1,500,000
$ 3,500,000
$ 1,150,000
1,410,000
$3,290,000
$1,160,000
150,000
$ 1,300,000
140,000
$1,300,000
Other expense (interest)
170,000
$ 1,130,000
150,000
Income before income tax
$1,150,000
Income tax expense.
230,000
225,000
$ 925,000
Net income
$ 900,000
...
Stargel Inc.
Comparative Balance Sheet
December 31, 20Y2 and 20Y1
20Υ2
20Υ1
Assets
Current assets:
Cash
$ 500,000
$ 400,000
...
Marketable securities...
Accounts receivable (net)...
1,010,000
1,000,000
740,000
510,000
Inventories...
1,190,000
950,000
Prepaid expenses.
250,000
229,000
Total current assets.
$3,690,000
$3,089,000
Long-term investments
2,350,000
2,300,000
Property, plant, and equipment (net)..
Total assets...
3,740,000
3,366,000
$9,780,000
$8,755,000
Liabilities
Current liabilities....
$ 900,000
$ 880,000
Long-term liabilities:
Mortgage note payable, 10%..
Bonds payable, 10%.....
Total long-term liabilities.....
Total liabilities
$ 200,000
%24
0.
1,500,000
$1,700,000
$2,600,000
1,500,000
$1,500,000
$2,380,000
Stockholders' Equity
Preferred $0.90 stock, $10 par.. . ..
Common stock, $5 par.....
$ 500,000
$ 500,000
500,000
500,000
Retained earnings....
6,180,000
$7,180,000
5,375,000
$6,375,000
Total stockholders' equity.....
Total liabilities and stockholders' equity..
$9,780,000
$8,755,000
Instructions
etermine the following measures for 20Y2, rounding to one decimal place including
Percentages, except for per-share amounts:
Expert Solution
This question has been solved!
Explore an expertly crafted, step-by-step solution for a thorough understanding of key concepts.

This is a popular solution!

Trending now
This is a popular solution!

Step by step
Solved in 6 steps

Knowledge Booster


Learn more about
Need a deep-dive on the concept behind this application? Look no further. Learn more about this topic, finance and related others by exploring similar questions and additional content below.Recommended textbooks for you
Survey of Accounting (Accounting I)
Accounting
ISBN:
9781305961883
Author:
Carl Warren
Publisher:
Cengage Learning

Managerial Accounting
Accounting
ISBN:
9781337912020
Author:
Carl Warren, Ph.d. Cma William B. Tayler
Publisher:
South-Western College Pub

Financial And Managerial Accounting
Accounting
ISBN:
9781337902663
Author:
WARREN, Carl S.
Publisher:
Cengage Learning,
Survey of Accounting (Accounting I)
Accounting
ISBN:
9781305961883
Author:
Carl Warren
Publisher:
Cengage Learning
Managerial Accounting
Accounting
ISBN:
9781337912020
Author:
Carl Warren, Ph.d. Cma William B. Tayler
Publisher:
South-Western College Pub
Financial And Managerial Accounting
Accounting
ISBN:
9781337902663
Author:
WARREN, Carl S.
Publisher:
Cengage Learning,

Financial Accounting: The Impact on Decision Make…
Accounting
ISBN:
9781305654174
Author:
Gary A. Porter, Curtis L. Norton
Publisher:
Cengage Learning

Managerial Accounting: The Cornerstone of Busines…
Accounting
ISBN:
9781337115773
Author:
Maryanne M. Mowen, Don R. Hansen, Dan L. Heitger
Publisher:
Cengage Learning

Financial Accounting
Accounting
ISBN:
9781337272124
Author:
Carl Warren, James M. Reeve, Jonathan Duchac
Publisher:
Cengage Learning